Yakama vs Immigrants from Hungary 3 or more Vehicles in Household
COMPARE
Yakama
Immigrants from Hungary
3 or more Vehicles in Household
3 or more Vehicles in Household Comparison
Yakama
Immigrants from Hungary
31.0%
3 OR MORE VEHICLES IN HOUSEHOLD
100.0/ 100
METRIC RATING
1st/ 347
METRIC RANK
18.5%
3 OR MORE VEHICLES IN HOUSEHOLD
5.5/ 100
METRIC RATING
226th/ 347
METRIC RANK
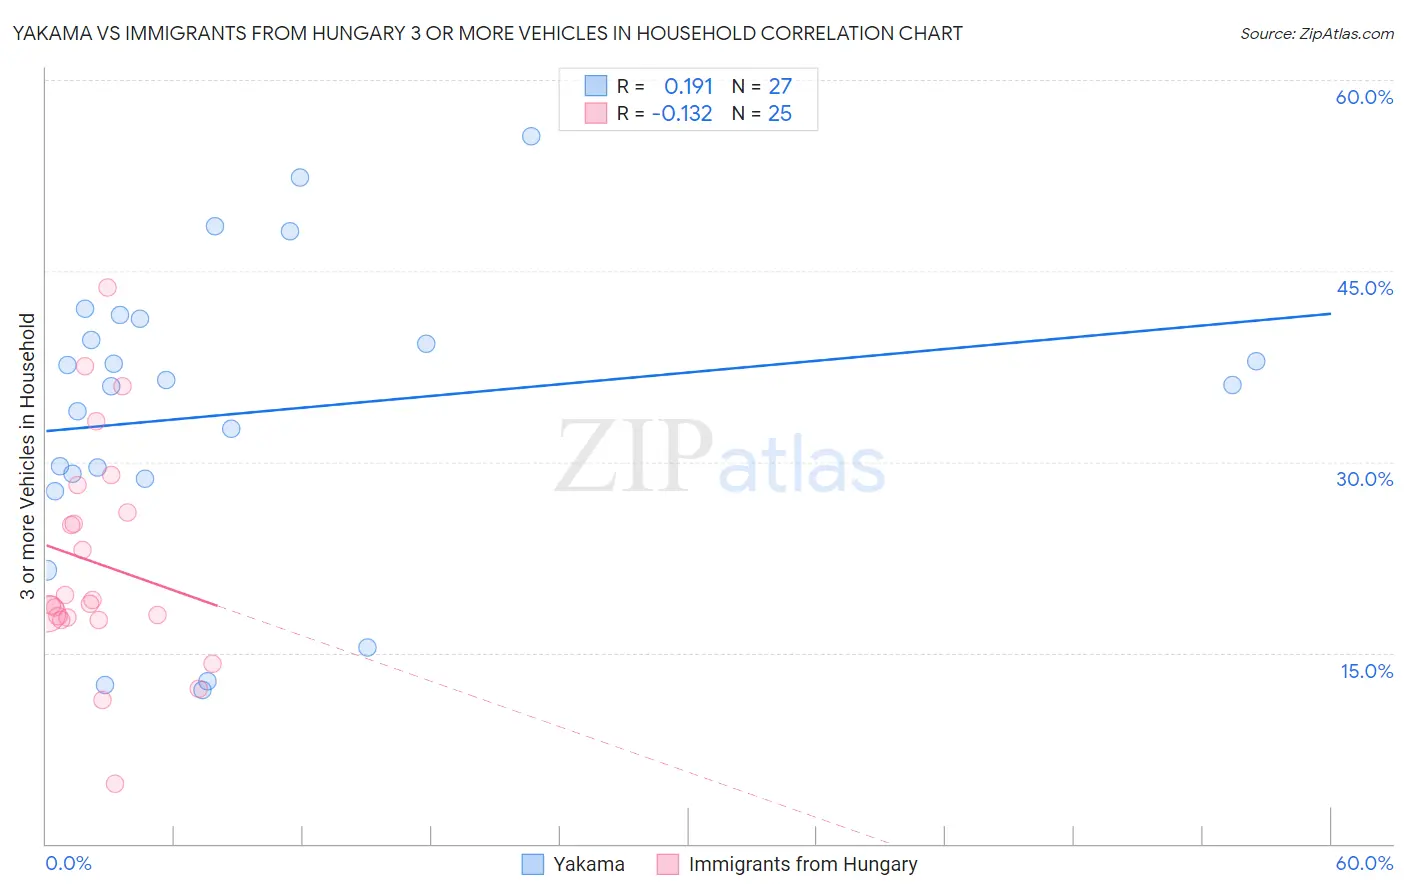
Yakama vs Immigrants from Hungary 3 or more Vehicles in Household Correlation Chart
The statistical analysis conducted on geographies consisting of 19,917,800 people shows a poor positive correlation between the proportion of Yakama and percentage of households with 3 or more vehicles available in the United States with a correlation coefficient (R) of 0.191 and weighted average of 31.0%. Similarly, the statistical analysis conducted on geographies consisting of 195,641,507 people shows a poor negative correlation between the proportion of Immigrants from Hungary and percentage of households with 3 or more vehicles available in the United States with a correlation coefficient (R) of -0.132 and weighted average of 18.5%, a difference of 67.9%.
3 or more Vehicles in Household Correlation Summary
| Measurement | Yakama | Immigrants from Hungary |
| Minimum | 12.1% | 4.8% |
| Maximum | 55.6% | 43.7% |
| Range | 43.5% | 39.0% |
| Mean | 33.9% | 22.0% |
| Median | 36.0% | 18.9% |
| Interquartile 25% (IQ1) | 28.7% | 17.7% |
| Interquartile 75% (IQ3) | 41.3% | 27.1% |
| Interquartile Range (IQR) | 12.6% | 9.4% |
| Standard Deviation (Sample) | 11.7% | 8.8% |
| Standard Deviation (Population) | 11.4% | 8.7% |
Similar Demographics by 3 or more Vehicles in Household
Demographics Similar to Yakama by 3 or more Vehicles in Household
In terms of 3 or more vehicles in household, the demographic groups most similar to Yakama are Spanish American Indian (26.9%, a difference of 15.0%), Tongan (26.5%, a difference of 16.8%), Arapaho (26.4%, a difference of 17.1%), Puget Sound Salish (26.4%, a difference of 17.5%), and Immigrants from Fiji (26.1%, a difference of 18.9%).
| Demographics | Rating | Rank | 3 or more Vehicles in Household |
| Yakama | 100.0 /100 | #1 | Exceptional 31.0% |
| Spanish American Indians | 100.0 /100 | #2 | Exceptional 26.9% |
| Tongans | 100.0 /100 | #3 | Exceptional 26.5% |
| Arapaho | 100.0 /100 | #4 | Exceptional 26.4% |
| Puget Sound Salish | 100.0 /100 | #5 | Exceptional 26.4% |
| Immigrants | Fiji | 100.0 /100 | #6 | Exceptional 26.1% |
| Colville | 100.0 /100 | #7 | Exceptional 25.8% |
| Samoans | 100.0 /100 | #8 | Exceptional 25.0% |
| Native Hawaiians | 100.0 /100 | #9 | Exceptional 24.9% |
| Nepalese | 100.0 /100 | #10 | Exceptional 24.9% |
| Shoshone | 100.0 /100 | #11 | Exceptional 24.9% |
| Danes | 100.0 /100 | #12 | Exceptional 24.7% |
| Mexicans | 100.0 /100 | #13 | Exceptional 24.7% |
| Immigrants | Mexico | 100.0 /100 | #14 | Exceptional 24.6% |
| Hawaiians | 100.0 /100 | #15 | Exceptional 24.3% |
Demographics Similar to Immigrants from Hungary by 3 or more Vehicles in Household
In terms of 3 or more vehicles in household, the demographic groups most similar to Immigrants from Hungary are Immigrants from Lithuania (18.5%, a difference of 0.030%), Immigrants from Singapore (18.4%, a difference of 0.030%), Immigrants from Argentina (18.5%, a difference of 0.040%), Turkish (18.4%, a difference of 0.050%), and Immigrants from Czechoslovakia (18.5%, a difference of 0.15%).
| Demographics | Rating | Rank | 3 or more Vehicles in Household |
| Immigrants | Armenia | 8.6 /100 | #219 | Tragic 18.6% |
| Nigerians | 7.9 /100 | #220 | Tragic 18.6% |
| Immigrants | Poland | 7.5 /100 | #221 | Tragic 18.6% |
| Belizeans | 7.3 /100 | #222 | Tragic 18.6% |
| Immigrants | Czechoslovakia | 5.9 /100 | #223 | Tragic 18.5% |
| Immigrants | Argentina | 5.6 /100 | #224 | Tragic 18.5% |
| Immigrants | Lithuania | 5.6 /100 | #225 | Tragic 18.5% |
| Immigrants | Hungary | 5.5 /100 | #226 | Tragic 18.5% |
| Immigrants | Singapore | 5.4 /100 | #227 | Tragic 18.4% |
| Turks | 5.4 /100 | #228 | Tragic 18.4% |
| Immigrants | Switzerland | 5.0 /100 | #229 | Tragic 18.4% |
| Immigrants | Western Asia | 4.8 /100 | #230 | Tragic 18.4% |
| Immigrants | Belgium | 4.8 /100 | #231 | Tragic 18.4% |
| Immigrants | Uganda | 4.6 /100 | #232 | Tragic 18.4% |
| Hondurans | 4.6 /100 | #233 | Tragic 18.4% |