Immigrants from Eastern Asia vs Immigrants from Hungary Male Disability
COMPARE
Immigrants from Eastern Asia
Immigrants from Hungary
Male Disability
Male Disability Comparison
Immigrants from Eastern Asia
Immigrants from Hungary
9.6%
MALE DISABILITY
100.0/ 100
METRIC RATING
11th/ 347
METRIC RANK
11.1%
MALE DISABILITY
61.2/ 100
METRIC RATING
166th/ 347
METRIC RANK
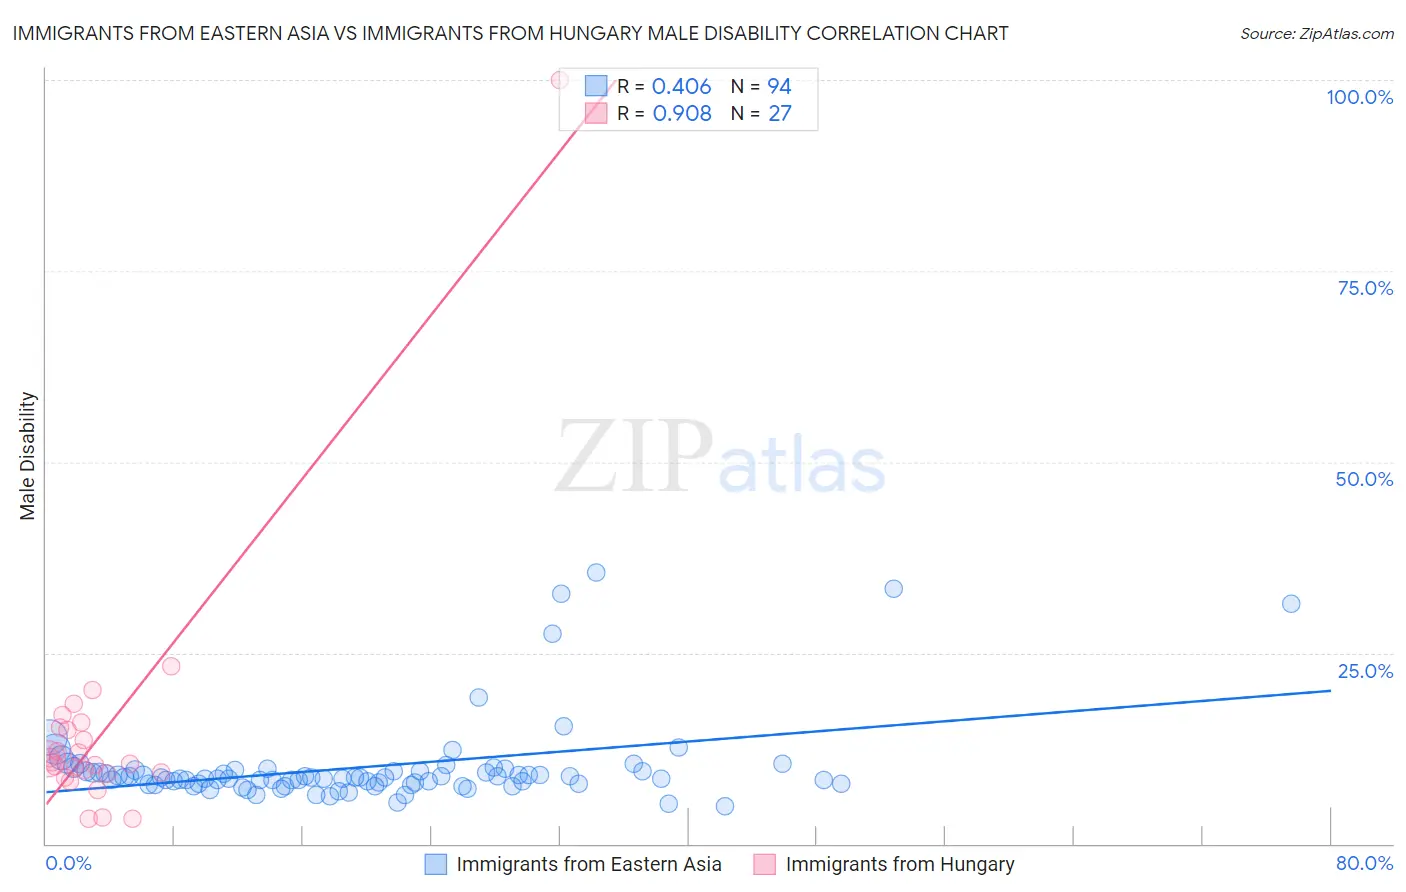
Immigrants from Eastern Asia vs Immigrants from Hungary Male Disability Correlation Chart
The statistical analysis conducted on geographies consisting of 499,820,999 people shows a moderate positive correlation between the proportion of Immigrants from Eastern Asia and percentage of males with a disability in the United States with a correlation coefficient (R) of 0.406 and weighted average of 9.6%. Similarly, the statistical analysis conducted on geographies consisting of 195,705,126 people shows a near-perfect positive correlation between the proportion of Immigrants from Hungary and percentage of males with a disability in the United States with a correlation coefficient (R) of 0.908 and weighted average of 11.1%, a difference of 15.9%.
Male Disability Correlation Summary
| Measurement | Immigrants from Eastern Asia | Immigrants from Hungary |
| Minimum | 4.9% | 3.2% |
| Maximum | 35.5% | 100.0% |
| Range | 30.6% | 96.8% |
| Mean | 10.0% | 14.7% |
| Median | 8.7% | 10.7% |
| Interquartile 25% (IQ1) | 7.9% | 9.1% |
| Interquartile 75% (IQ3) | 9.5% | 15.3% |
| Interquartile Range (IQR) | 1.6% | 6.1% |
| Standard Deviation (Sample) | 5.6% | 17.7% |
| Standard Deviation (Population) | 5.6% | 17.4% |
Similar Demographics by Male Disability
Demographics Similar to Immigrants from Eastern Asia by Male Disability
In terms of male disability, the demographic groups most similar to Immigrants from Eastern Asia are Bolivian (9.6%, a difference of 0.24%), Iranian (9.7%, a difference of 0.46%), Immigrants from Israel (9.6%, a difference of 0.55%), Immigrants from Iran (9.7%, a difference of 0.56%), and Immigrants from Singapore (9.5%, a difference of 0.98%).
| Demographics | Rating | Rank | Male Disability |
| Thais | 100.0 /100 | #4 | Exceptional 9.2% |
| Immigrants | Hong Kong | 100.0 /100 | #5 | Exceptional 9.4% |
| Immigrants | South Central Asia | 100.0 /100 | #6 | Exceptional 9.4% |
| Immigrants | Bolivia | 100.0 /100 | #7 | Exceptional 9.5% |
| Immigrants | China | 100.0 /100 | #8 | Exceptional 9.5% |
| Immigrants | Singapore | 100.0 /100 | #9 | Exceptional 9.5% |
| Immigrants | Israel | 100.0 /100 | #10 | Exceptional 9.6% |
| Immigrants | Eastern Asia | 100.0 /100 | #11 | Exceptional 9.6% |
| Bolivians | 100.0 /100 | #12 | Exceptional 9.6% |
| Iranians | 100.0 /100 | #13 | Exceptional 9.7% |
| Immigrants | Iran | 100.0 /100 | #14 | Exceptional 9.7% |
| Indians (Asian) | 100.0 /100 | #15 | Exceptional 9.7% |
| Okinawans | 100.0 /100 | #16 | Exceptional 9.8% |
| Immigrants | Korea | 100.0 /100 | #17 | Exceptional 9.8% |
| Immigrants | Pakistan | 100.0 /100 | #18 | Exceptional 9.8% |
Demographics Similar to Immigrants from Hungary by Male Disability
In terms of male disability, the demographic groups most similar to Immigrants from Hungary are Luxembourger (11.1%, a difference of 0.040%), British West Indian (11.1%, a difference of 0.090%), Immigrants from Kenya (11.1%, a difference of 0.15%), Immigrants from Haiti (11.1%, a difference of 0.25%), and Immigrants from West Indies (11.1%, a difference of 0.27%).
| Demographics | Rating | Rank | Male Disability |
| Guatemalans | 67.2 /100 | #159 | Good 11.1% |
| Albanians | 66.5 /100 | #160 | Good 11.1% |
| Immigrants | West Indies | 65.7 /100 | #161 | Good 11.1% |
| Immigrants | Haiti | 65.3 /100 | #162 | Good 11.1% |
| Immigrants | Kenya | 63.8 /100 | #163 | Good 11.1% |
| British West Indians | 62.8 /100 | #164 | Good 11.1% |
| Luxembourgers | 61.9 /100 | #165 | Good 11.1% |
| Immigrants | Hungary | 61.2 /100 | #166 | Good 11.1% |
| Immigrants | Southern Europe | 54.4 /100 | #167 | Average 11.2% |
| Immigrants | Latin America | 54.0 /100 | #168 | Average 11.2% |
| Barbadians | 53.4 /100 | #169 | Average 11.2% |
| New Zealanders | 52.9 /100 | #170 | Average 11.2% |
| Haitians | 52.5 /100 | #171 | Average 11.2% |
| Romanians | 50.7 /100 | #172 | Average 11.2% |
| Immigrants | Burma/Myanmar | 50.4 /100 | #173 | Average 11.2% |