Immigrants from Cuba vs Thai Child Poverty Under the Age of 16
COMPARE
Immigrants from Cuba
Thai
Child Poverty Under the Age of 16
Child Poverty Under the Age of 16 Comparison
Immigrants from Cuba
Thais
18.7%
CHILD POVERTY UNDER THE AGE OF 16
0.6/ 100
METRIC RATING
243rd/ 347
METRIC RANK
11.6%
CHILD POVERTY UNDER THE AGE OF 16
100.0/ 100
METRIC RATING
4th/ 347
METRIC RANK
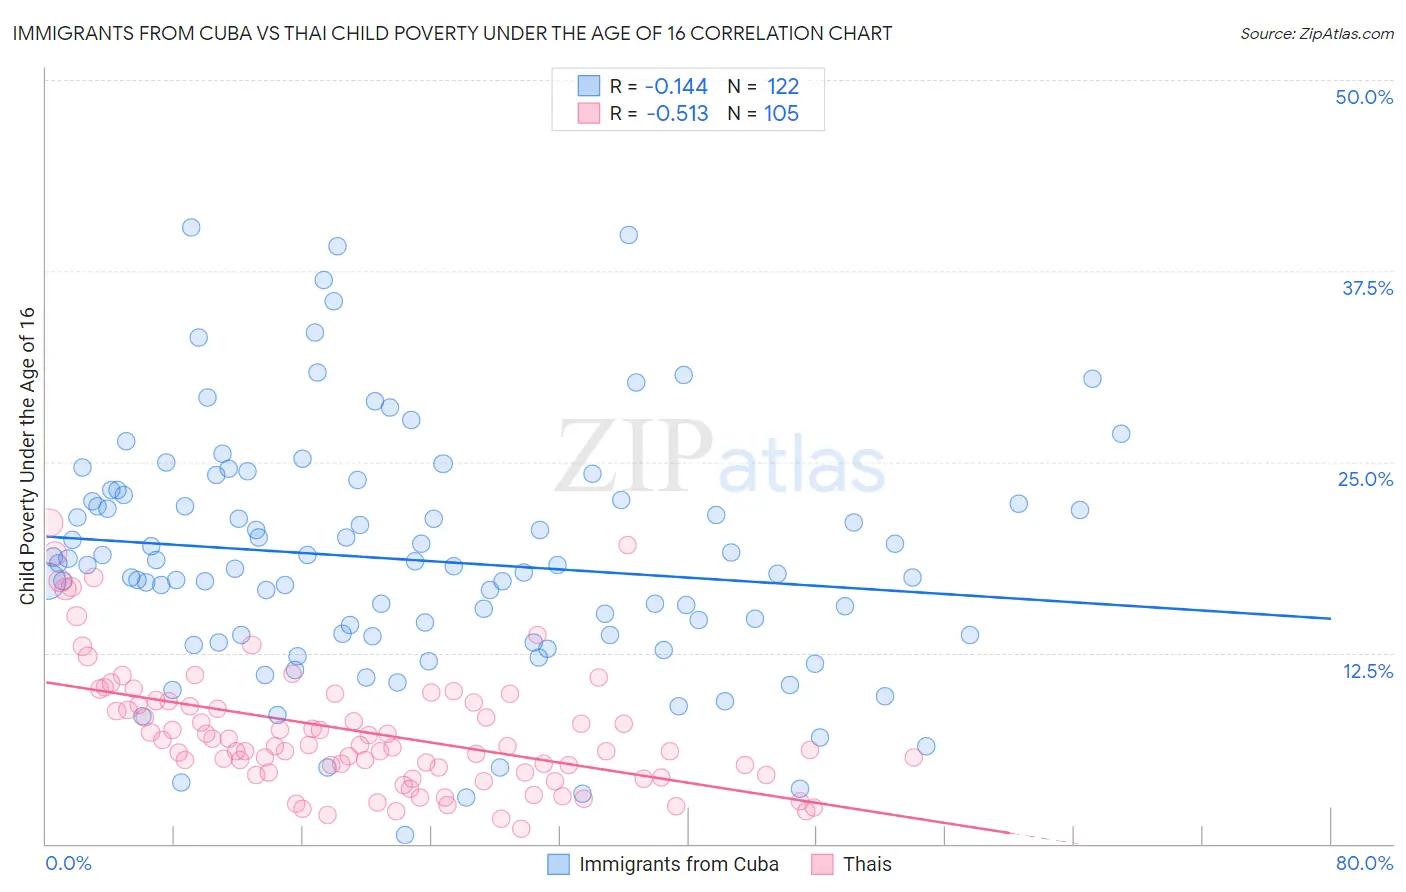
Immigrants from Cuba vs Thai Child Poverty Under the Age of 16 Correlation Chart
The statistical analysis conducted on geographies consisting of 323,831,024 people shows a poor negative correlation between the proportion of Immigrants from Cuba and poverty level among children under the age of 16 in the United States with a correlation coefficient (R) of -0.144 and weighted average of 18.7%. Similarly, the statistical analysis conducted on geographies consisting of 469,747,555 people shows a substantial negative correlation between the proportion of Thais and poverty level among children under the age of 16 in the United States with a correlation coefficient (R) of -0.513 and weighted average of 11.6%, a difference of 61.6%.
Child Poverty Under the Age of 16 Correlation Summary
| Measurement | Immigrants from Cuba | Thai |
| Minimum | 0.61% | 1.0% |
| Maximum | 40.4% | 21.0% |
| Range | 39.8% | 20.0% |
| Mean | 18.6% | 7.3% |
| Median | 18.2% | 6.4% |
| Interquartile 25% (IQ1) | 13.6% | 4.6% |
| Interquartile 75% (IQ3) | 22.5% | 9.3% |
| Interquartile Range (IQR) | 8.9% | 4.7% |
| Standard Deviation (Sample) | 7.8% | 4.1% |
| Standard Deviation (Population) | 7.8% | 4.1% |
Similar Demographics by Child Poverty Under the Age of 16
Demographics Similar to Immigrants from Cuba by Child Poverty Under the Age of 16
In terms of child poverty under the age of 16, the demographic groups most similar to Immigrants from Cuba are Cape Verdean (18.7%, a difference of 0.070%), Immigrants from Laos (18.7%, a difference of 0.13%), Alsatian (18.6%, a difference of 0.25%), Ghanaian (18.6%, a difference of 0.71%), and Shoshone (18.8%, a difference of 0.72%).
| Demographics | Rating | Rank | Child Poverty Under the Age of 16 |
| Cree | 0.9 /100 | #236 | Tragic 18.5% |
| Sudanese | 0.9 /100 | #237 | Tragic 18.5% |
| Immigrants | Eritrea | 0.8 /100 | #238 | Tragic 18.5% |
| Immigrants | Sudan | 0.8 /100 | #239 | Tragic 18.5% |
| Ghanaians | 0.8 /100 | #240 | Tragic 18.6% |
| Alsatians | 0.7 /100 | #241 | Tragic 18.6% |
| Immigrants | Laos | 0.6 /100 | #242 | Tragic 18.7% |
| Immigrants | Cuba | 0.6 /100 | #243 | Tragic 18.7% |
| Cape Verdeans | 0.6 /100 | #244 | Tragic 18.7% |
| Shoshone | 0.5 /100 | #245 | Tragic 18.8% |
| Immigrants | Nicaragua | 0.4 /100 | #246 | Tragic 18.8% |
| French American Indians | 0.4 /100 | #247 | Tragic 18.9% |
| Ecuadorians | 0.3 /100 | #248 | Tragic 19.0% |
| Potawatomi | 0.3 /100 | #249 | Tragic 19.0% |
| Immigrants | Middle Africa | 0.3 /100 | #250 | Tragic 19.0% |
Demographics Similar to Thais by Child Poverty Under the Age of 16
In terms of child poverty under the age of 16, the demographic groups most similar to Thais are Chinese (11.9%, a difference of 3.1%), Filipino (11.1%, a difference of 3.9%), Immigrants from Taiwan (11.0%, a difference of 4.8%), Immigrants from Hong Kong (12.1%, a difference of 5.0%), and Iranian (12.2%, a difference of 5.8%).
| Demographics | Rating | Rank | Child Poverty Under the Age of 16 |
| Immigrants | India | 100.0 /100 | #1 | Exceptional 10.8% |
| Immigrants | Taiwan | 100.0 /100 | #2 | Exceptional 11.0% |
| Filipinos | 100.0 /100 | #3 | Exceptional 11.1% |
| Thais | 100.0 /100 | #4 | Exceptional 11.6% |
| Chinese | 100.0 /100 | #5 | Exceptional 11.9% |
| Immigrants | Hong Kong | 100.0 /100 | #6 | Exceptional 12.1% |
| Iranians | 100.0 /100 | #7 | Exceptional 12.2% |
| Immigrants | Singapore | 100.0 /100 | #8 | Exceptional 12.4% |
| Immigrants | Iran | 100.0 /100 | #9 | Exceptional 12.4% |
| Immigrants | South Central Asia | 99.9 /100 | #10 | Exceptional 12.5% |
| Bhutanese | 99.9 /100 | #11 | Exceptional 12.5% |
| Immigrants | Ireland | 99.9 /100 | #12 | Exceptional 12.7% |
| Burmese | 99.9 /100 | #13 | Exceptional 12.8% |
| Immigrants | Lithuania | 99.9 /100 | #14 | Exceptional 12.9% |
| Immigrants | Korea | 99.9 /100 | #15 | Exceptional 13.0% |