Immigrants from China vs Uruguayan In Labor Force | Age 35-44
COMPARE
Immigrants from China
Uruguayan
In Labor Force | Age 35-44
In Labor Force | Age 35-44 Comparison
Immigrants from China
Uruguayans
84.7%
IN LABOR FORCE | AGE 35-44
92.3/ 100
METRIC RATING
117th/ 347
METRIC RANK
84.7%
IN LABOR FORCE | AGE 35-44
93.3/ 100
METRIC RATING
113th/ 347
METRIC RANK
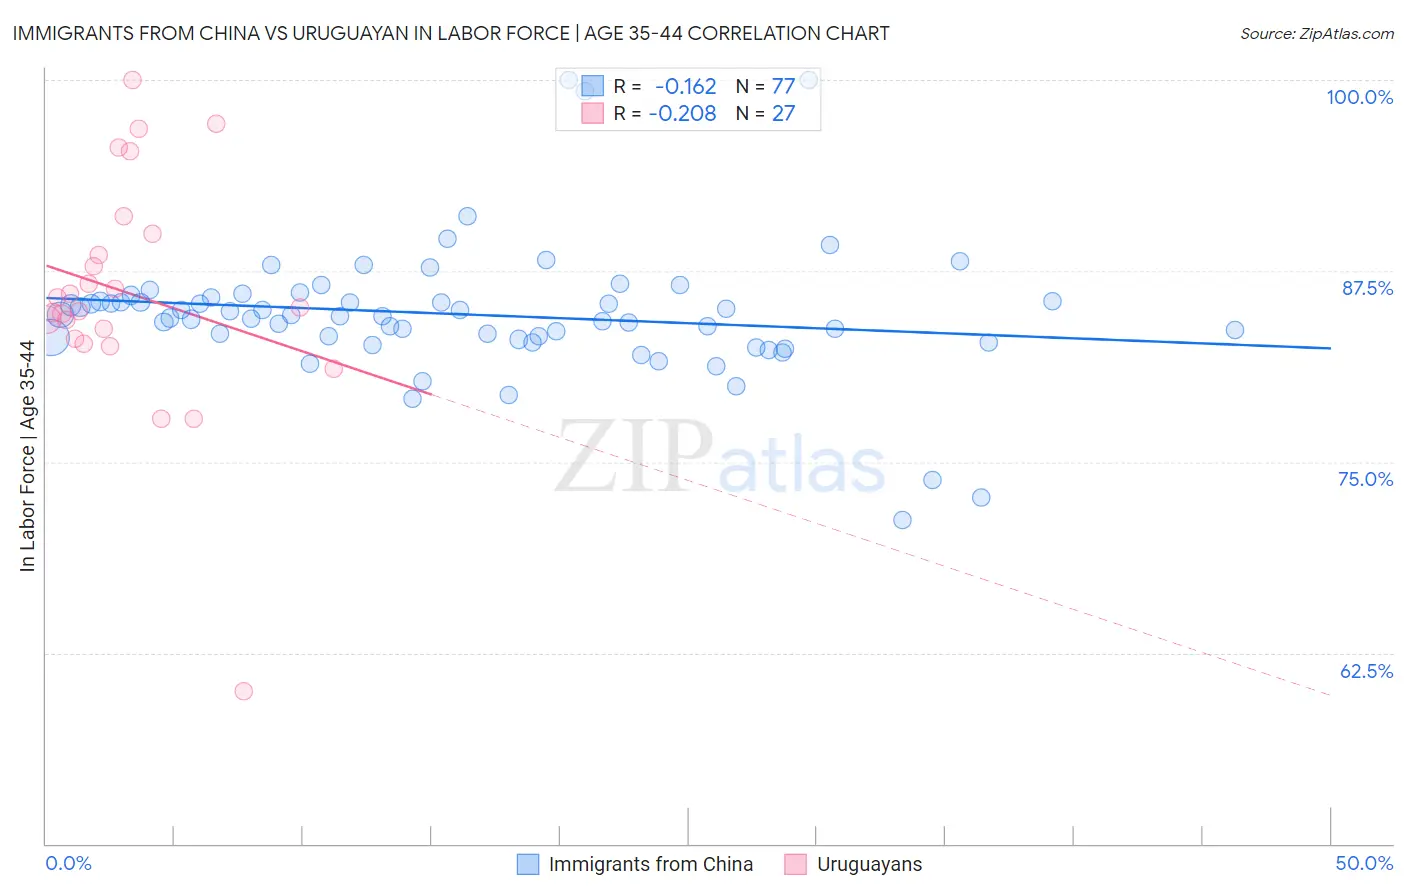
Immigrants from China vs Uruguayan In Labor Force | Age 35-44 Correlation Chart
The statistical analysis conducted on geographies consisting of 456,678,998 people shows a poor negative correlation between the proportion of Immigrants from China and labor force participation rate among population between the ages 35 and 44 in the United States with a correlation coefficient (R) of -0.162 and weighted average of 84.7%. Similarly, the statistical analysis conducted on geographies consisting of 144,759,771 people shows a weak negative correlation between the proportion of Uruguayans and labor force participation rate among population between the ages 35 and 44 in the United States with a correlation coefficient (R) of -0.208 and weighted average of 84.7%, a difference of 0.020%.
In Labor Force | Age 35-44 Correlation Summary
| Measurement | Immigrants from China | Uruguayan |
| Minimum | 71.2% | 60.0% |
| Maximum | 100.0% | 100.0% |
| Range | 28.8% | 40.0% |
| Mean | 84.6% | 86.1% |
| Median | 84.5% | 85.1% |
| Interquartile 25% (IQ1) | 83.1% | 83.0% |
| Interquartile 75% (IQ3) | 85.6% | 90.0% |
| Interquartile Range (IQR) | 2.5% | 7.0% |
| Standard Deviation (Sample) | 4.4% | 7.7% |
| Standard Deviation (Population) | 4.4% | 7.6% |
Demographics Similar to Immigrants from China and Uruguayans by In Labor Force | Age 35-44
In terms of in labor force | age 35-44, the demographic groups most similar to Immigrants from China are Immigrants from Eastern Asia (84.7%, a difference of 0.0%), Immigrants from Egypt (84.7%, a difference of 0.010%), Burmese (84.7%, a difference of 0.010%), Chilean (84.7%, a difference of 0.020%), and Bahamian (84.7%, a difference of 0.020%). Similarly, the demographic groups most similar to Uruguayans are Immigrants from Western Africa (84.7%, a difference of 0.0%), Chilean (84.7%, a difference of 0.0%), Bahamian (84.7%, a difference of 0.0%), Filipino (84.7%, a difference of 0.010%), and Ukrainian (84.7%, a difference of 0.010%).
| Demographics | Rating | Rank | In Labor Force | Age 35-44 |
| South Americans | 95.0 /100 | #105 | Exceptional 84.8% |
| Immigrants | Bahamas | 94.8 /100 | #106 | Exceptional 84.8% |
| Immigrants | Romania | 94.7 /100 | #107 | Exceptional 84.8% |
| Immigrants | Argentina | 94.5 /100 | #108 | Exceptional 84.8% |
| Immigrants | Russia | 94.5 /100 | #109 | Exceptional 84.8% |
| Filipinos | 93.8 /100 | #110 | Exceptional 84.7% |
| Ukrainians | 93.5 /100 | #111 | Exceptional 84.7% |
| Immigrants | Western Africa | 93.4 /100 | #112 | Exceptional 84.7% |
| Uruguayans | 93.3 /100 | #113 | Exceptional 84.7% |
| Chileans | 93.2 /100 | #114 | Exceptional 84.7% |
| Bahamians | 93.2 /100 | #115 | Exceptional 84.7% |
| Immigrants | Egypt | 92.7 /100 | #116 | Exceptional 84.7% |
| Immigrants | China | 92.3 /100 | #117 | Exceptional 84.7% |
| Immigrants | Eastern Asia | 92.1 /100 | #118 | Exceptional 84.7% |
| Burmese | 91.8 /100 | #119 | Exceptional 84.7% |
| Immigrants | Northern Europe | 91.5 /100 | #120 | Exceptional 84.7% |
| Finns | 91.2 /100 | #121 | Exceptional 84.7% |
| Germans | 91.0 /100 | #122 | Exceptional 84.7% |
| Immigrants | South America | 90.9 /100 | #123 | Exceptional 84.7% |
| Slavs | 90.8 /100 | #124 | Exceptional 84.7% |
| Maltese | 90.8 /100 | #125 | Exceptional 84.7% |