Immigrants from Burma/Myanmar vs Serbian 2 or more Vehicles in Household
COMPARE
Immigrants from Burma/Myanmar
Serbian
2 or more Vehicles in Household
2 or more Vehicles in Household Comparison
Immigrants from Burma/Myanmar
Serbians
53.9%
2 OR MORE VEHICLES IN HOUSEHOLD
7.1/ 100
METRIC RATING
217th/ 347
METRIC RANK
56.1%
2 OR MORE VEHICLES IN HOUSEHOLD
80.3/ 100
METRIC RATING
147th/ 347
METRIC RANK
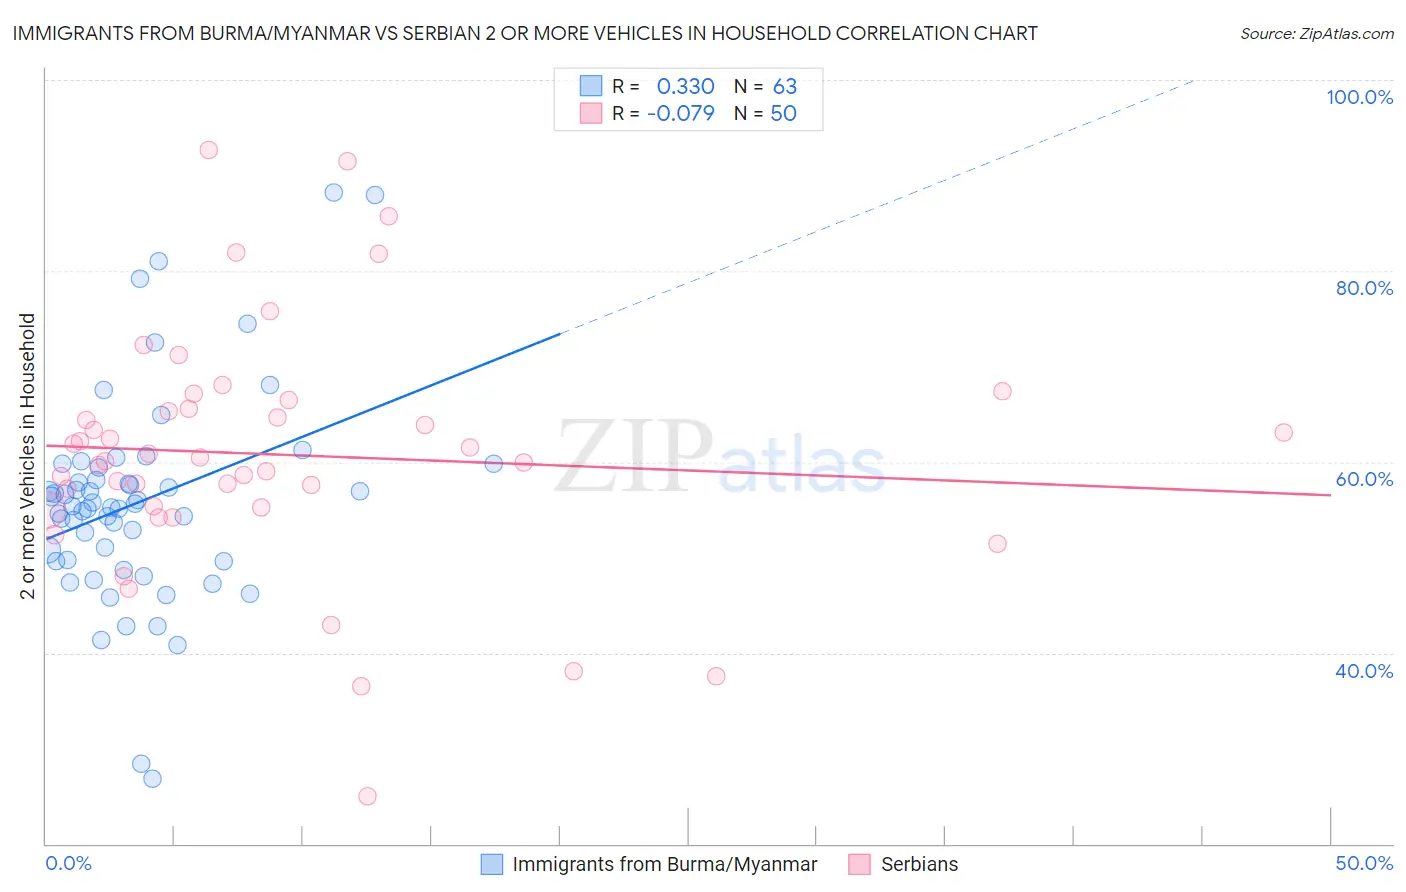
Immigrants from Burma/Myanmar vs Serbian 2 or more Vehicles in Household Correlation Chart
The statistical analysis conducted on geographies consisting of 172,281,201 people shows a mild positive correlation between the proportion of Immigrants from Burma/Myanmar and percentage of households with 2 or more vehicles available in the United States with a correlation coefficient (R) of 0.330 and weighted average of 53.9%. Similarly, the statistical analysis conducted on geographies consisting of 267,548,486 people shows a slight negative correlation between the proportion of Serbians and percentage of households with 2 or more vehicles available in the United States with a correlation coefficient (R) of -0.079 and weighted average of 56.1%, a difference of 4.1%.
2 or more Vehicles in Household Correlation Summary
| Measurement | Immigrants from Burma/Myanmar | Serbian |
| Minimum | 26.8% | 25.0% |
| Maximum | 88.2% | 92.6% |
| Range | 61.4% | 67.6% |
| Mean | 55.8% | 60.8% |
| Median | 55.3% | 60.2% |
| Interquartile 25% (IQ1) | 49.6% | 55.2% |
| Interquartile 75% (IQ3) | 59.4% | 65.6% |
| Interquartile Range (IQR) | 9.8% | 10.4% |
| Standard Deviation (Sample) | 11.1% | 12.9% |
| Standard Deviation (Population) | 11.0% | 12.8% |
Similar Demographics by 2 or more Vehicles in Household
Demographics Similar to Immigrants from Burma/Myanmar by 2 or more Vehicles in Household
In terms of 2 or more vehicles in household, the demographic groups most similar to Immigrants from Burma/Myanmar are Immigrants from Argentina (53.9%, a difference of 0.050%), South American Indian (53.9%, a difference of 0.11%), Taiwanese (53.9%, a difference of 0.13%), Immigrants from Singapore (53.9%, a difference of 0.14%), and Kiowa (53.9%, a difference of 0.16%).
| Demographics | Rating | Rank | 2 or more Vehicles in Household |
| Immigrants | Saudi Arabia | 11.3 /100 | #210 | Poor 54.2% |
| Immigrants | Hungary | 11.3 /100 | #211 | Poor 54.2% |
| Immigrants | Chile | 11.1 /100 | #212 | Poor 54.2% |
| Guatemalans | 9.6 /100 | #213 | Tragic 54.1% |
| Immigrants | Czechoslovakia | 9.4 /100 | #214 | Tragic 54.1% |
| Aleuts | 9.3 /100 | #215 | Tragic 54.1% |
| Immigrants | Western Asia | 9.3 /100 | #216 | Tragic 54.1% |
| Immigrants | Burma/Myanmar | 7.1 /100 | #217 | Tragic 53.9% |
| Immigrants | Argentina | 6.8 /100 | #218 | Tragic 53.9% |
| South American Indians | 6.5 /100 | #219 | Tragic 53.9% |
| Taiwanese | 6.3 /100 | #220 | Tragic 53.9% |
| Immigrants | Singapore | 6.3 /100 | #221 | Tragic 53.9% |
| Kiowa | 6.2 /100 | #222 | Tragic 53.9% |
| Immigrants | Bosnia and Herzegovina | 5.5 /100 | #223 | Tragic 53.8% |
| Brazilians | 5.3 /100 | #224 | Tragic 53.8% |
Demographics Similar to Serbians by 2 or more Vehicles in Household
In terms of 2 or more vehicles in household, the demographic groups most similar to Serbians are Immigrants from Moldova (56.1%, a difference of 0.0%), Chilean (56.1%, a difference of 0.010%), Venezuelan (56.1%, a difference of 0.020%), Nicaraguan (56.1%, a difference of 0.030%), and Syrian (56.2%, a difference of 0.060%).
| Demographics | Rating | Rank | 2 or more Vehicles in Household |
| Latvians | 83.6 /100 | #140 | Excellent 56.2% |
| Immigrants | Cambodia | 83.6 /100 | #141 | Excellent 56.2% |
| South Africans | 83.1 /100 | #142 | Excellent 56.2% |
| Seminole | 81.7 /100 | #143 | Excellent 56.2% |
| Immigrants | Syria | 81.4 /100 | #144 | Excellent 56.2% |
| Syrians | 81.2 /100 | #145 | Excellent 56.2% |
| Venezuelans | 80.7 /100 | #146 | Excellent 56.1% |
| Serbians | 80.3 /100 | #147 | Excellent 56.1% |
| Immigrants | Moldova | 80.2 /100 | #148 | Excellent 56.1% |
| Chileans | 80.2 /100 | #149 | Excellent 56.1% |
| Nicaraguans | 79.9 /100 | #150 | Good 56.1% |
| Immigrants | Northern Europe | 78.7 /100 | #151 | Good 56.1% |
| Immigrants | Pakistan | 78.1 /100 | #152 | Good 56.1% |
| Lumbee | 71.9 /100 | #153 | Good 55.9% |
| Ukrainians | 70.8 /100 | #154 | Good 55.8% |