Cuban vs Serbian 2 or more Vehicles in Household
COMPARE
Cuban
Serbian
2 or more Vehicles in Household
2 or more Vehicles in Household Comparison
Cubans
Serbians
56.3%
2 OR MORE VEHICLES IN HOUSEHOLD
84.8/ 100
METRIC RATING
137th/ 347
METRIC RANK
56.1%
2 OR MORE VEHICLES IN HOUSEHOLD
80.3/ 100
METRIC RATING
147th/ 347
METRIC RANK
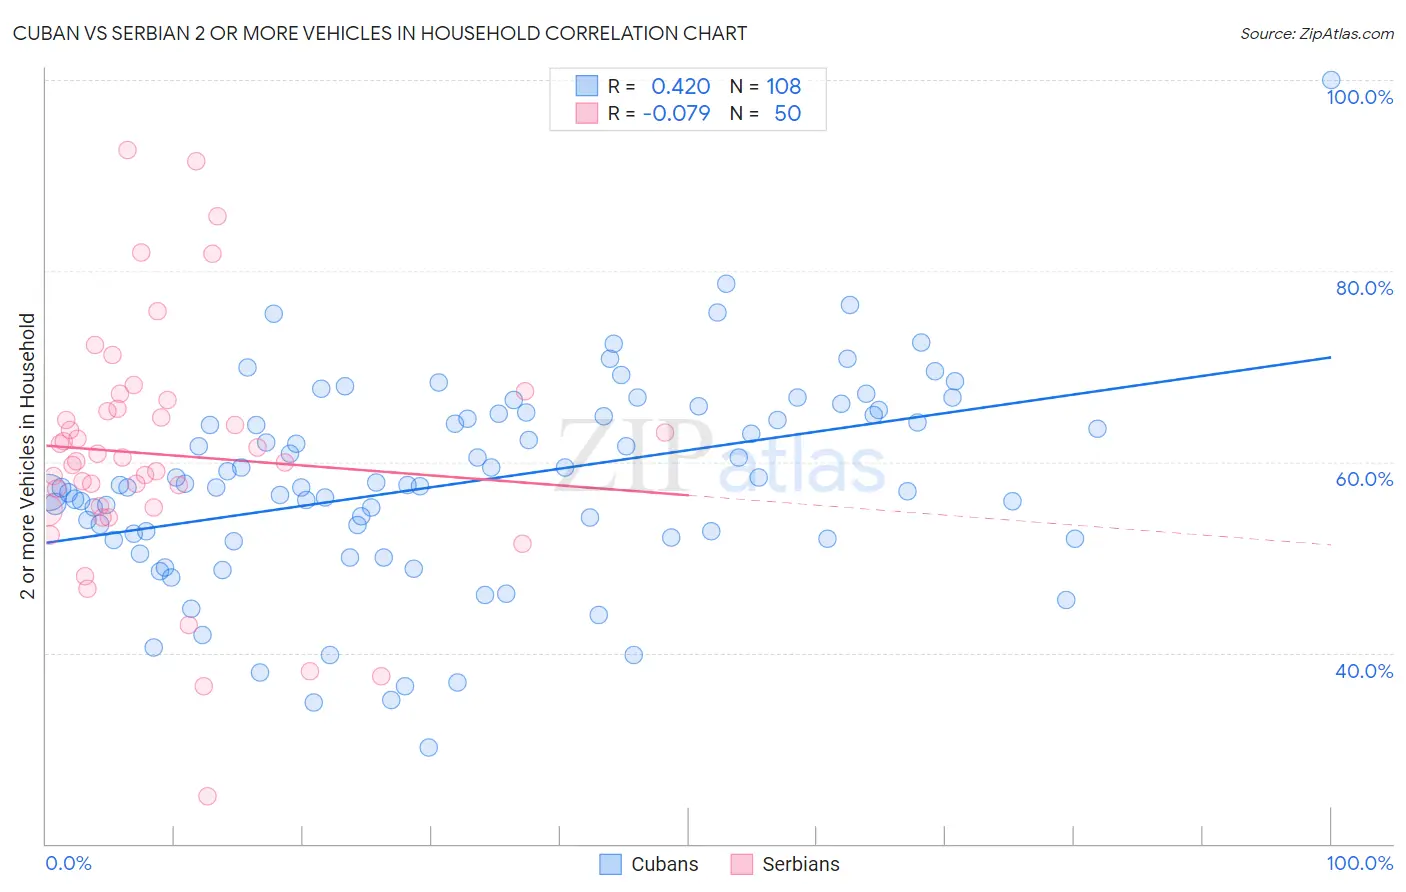
Cuban vs Serbian 2 or more Vehicles in Household Correlation Chart
The statistical analysis conducted on geographies consisting of 448,997,187 people shows a moderate positive correlation between the proportion of Cubans and percentage of households with 2 or more vehicles available in the United States with a correlation coefficient (R) of 0.420 and weighted average of 56.3%. Similarly, the statistical analysis conducted on geographies consisting of 267,548,486 people shows a slight negative correlation between the proportion of Serbians and percentage of households with 2 or more vehicles available in the United States with a correlation coefficient (R) of -0.079 and weighted average of 56.1%, a difference of 0.31%.
2 or more Vehicles in Household Correlation Summary
| Measurement | Cuban | Serbian |
| Minimum | 30.1% | 25.0% |
| Maximum | 100.0% | 92.6% |
| Range | 69.9% | 67.6% |
| Mean | 57.8% | 60.8% |
| Median | 57.5% | 60.2% |
| Interquartile 25% (IQ1) | 52.0% | 55.2% |
| Interquartile 75% (IQ3) | 64.9% | 65.6% |
| Interquartile Range (IQR) | 12.8% | 10.4% |
| Standard Deviation (Sample) | 10.6% | 12.9% |
| Standard Deviation (Population) | 10.6% | 12.8% |
Demographics Similar to Cubans and Serbians by 2 or more Vehicles in Household
In terms of 2 or more vehicles in household, the demographic groups most similar to Cubans are Salvadoran (56.3%, a difference of 0.010%), Armenian (56.3%, a difference of 0.040%), Immigrants from Asia (56.3%, a difference of 0.090%), Latvian (56.2%, a difference of 0.090%), and Immigrants from Cambodia (56.2%, a difference of 0.090%). Similarly, the demographic groups most similar to Serbians are Immigrants from Moldova (56.1%, a difference of 0.0%), Chilean (56.1%, a difference of 0.010%), Venezuelan (56.1%, a difference of 0.020%), Nicaraguan (56.1%, a difference of 0.030%), and Syrian (56.2%, a difference of 0.060%).
| Demographics | Rating | Rank | 2 or more Vehicles in Household |
| Hungarians | 89.1 /100 | #132 | Excellent 56.5% |
| Comanche | 88.4 /100 | #133 | Excellent 56.5% |
| Immigrants | Azores | 86.6 /100 | #134 | Excellent 56.4% |
| Blackfeet | 86.5 /100 | #135 | Excellent 56.4% |
| Immigrants | Asia | 86.0 /100 | #136 | Excellent 56.3% |
| Cubans | 84.8 /100 | #137 | Excellent 56.3% |
| Salvadorans | 84.7 /100 | #138 | Excellent 56.3% |
| Armenians | 84.3 /100 | #139 | Excellent 56.3% |
| Latvians | 83.6 /100 | #140 | Excellent 56.2% |
| Immigrants | Cambodia | 83.6 /100 | #141 | Excellent 56.2% |
| South Africans | 83.1 /100 | #142 | Excellent 56.2% |
| Seminole | 81.7 /100 | #143 | Excellent 56.2% |
| Immigrants | Syria | 81.4 /100 | #144 | Excellent 56.2% |
| Syrians | 81.2 /100 | #145 | Excellent 56.2% |
| Venezuelans | 80.7 /100 | #146 | Excellent 56.1% |
| Serbians | 80.3 /100 | #147 | Excellent 56.1% |
| Immigrants | Moldova | 80.2 /100 | #148 | Excellent 56.1% |
| Chileans | 80.2 /100 | #149 | Excellent 56.1% |
| Nicaraguans | 79.9 /100 | #150 | Good 56.1% |
| Immigrants | Northern Europe | 78.7 /100 | #151 | Good 56.1% |
| Immigrants | Pakistan | 78.1 /100 | #152 | Good 56.1% |