Immigrants from Burma/Myanmar vs Luxembourger 2 or more Vehicles in Household
COMPARE
Immigrants from Burma/Myanmar
Luxembourger
2 or more Vehicles in Household
2 or more Vehicles in Household Comparison
Immigrants from Burma/Myanmar
Luxembourgers
53.9%
2 OR MORE VEHICLES IN HOUSEHOLD
7.1/ 100
METRIC RATING
217th/ 347
METRIC RANK
59.1%
2 OR MORE VEHICLES IN HOUSEHOLD
99.9/ 100
METRIC RATING
55th/ 347
METRIC RANK
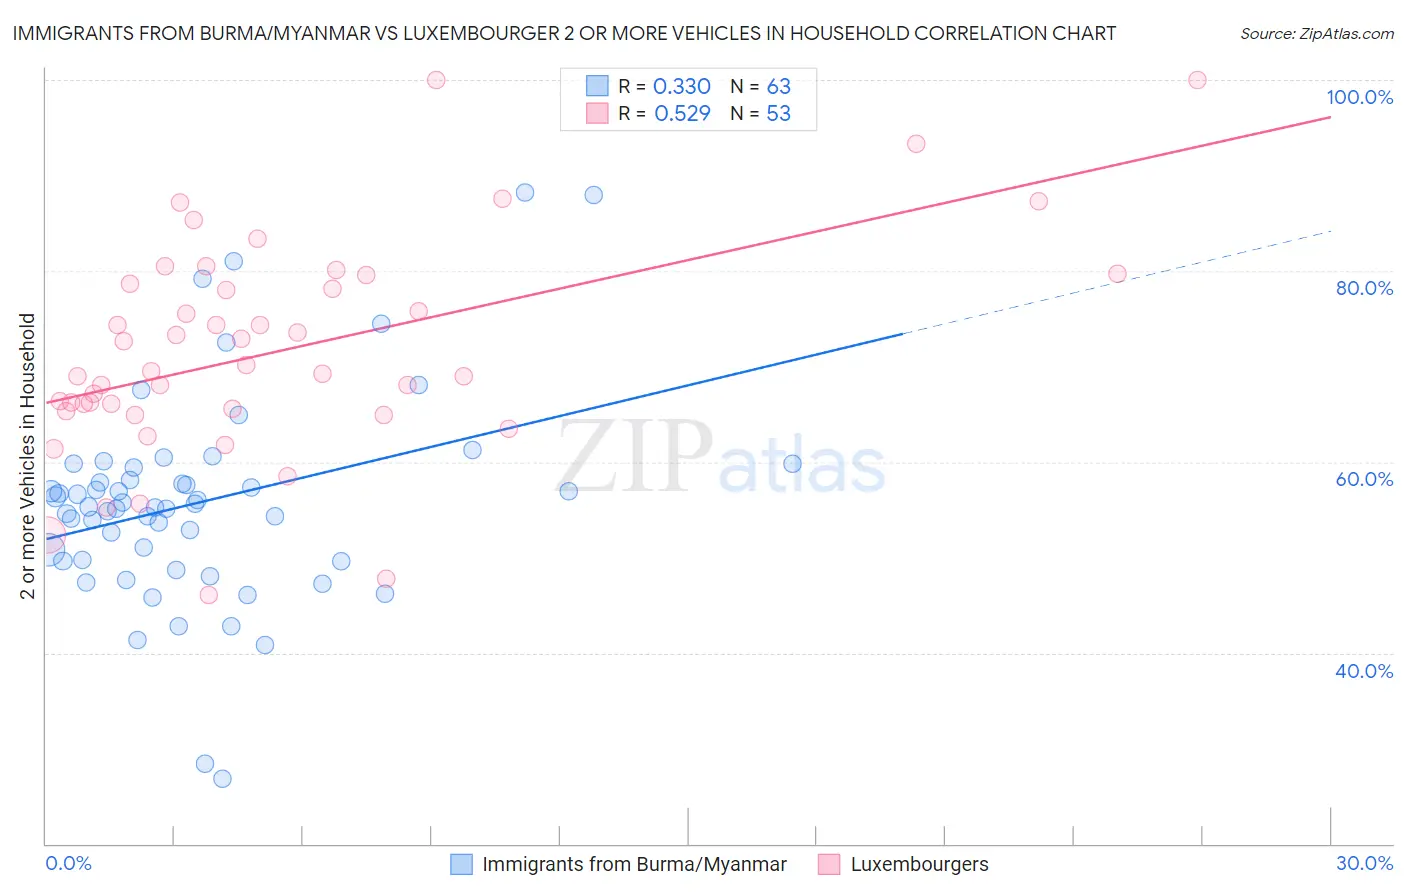
Immigrants from Burma/Myanmar vs Luxembourger 2 or more Vehicles in Household Correlation Chart
The statistical analysis conducted on geographies consisting of 172,281,201 people shows a mild positive correlation between the proportion of Immigrants from Burma/Myanmar and percentage of households with 2 or more vehicles available in the United States with a correlation coefficient (R) of 0.330 and weighted average of 53.9%. Similarly, the statistical analysis conducted on geographies consisting of 144,657,746 people shows a substantial positive correlation between the proportion of Luxembourgers and percentage of households with 2 or more vehicles available in the United States with a correlation coefficient (R) of 0.529 and weighted average of 59.1%, a difference of 9.5%.
2 or more Vehicles in Household Correlation Summary
| Measurement | Immigrants from Burma/Myanmar | Luxembourger |
| Minimum | 26.8% | 46.0% |
| Maximum | 88.2% | 100.0% |
| Range | 61.4% | 54.0% |
| Mean | 55.8% | 71.7% |
| Median | 55.3% | 69.5% |
| Interquartile 25% (IQ1) | 49.6% | 65.4% |
| Interquartile 75% (IQ3) | 59.4% | 79.1% |
| Interquartile Range (IQR) | 9.8% | 13.7% |
| Standard Deviation (Sample) | 11.1% | 11.4% |
| Standard Deviation (Population) | 11.0% | 11.3% |
Similar Demographics by 2 or more Vehicles in Household
Demographics Similar to Immigrants from Burma/Myanmar by 2 or more Vehicles in Household
In terms of 2 or more vehicles in household, the demographic groups most similar to Immigrants from Burma/Myanmar are Immigrants from Argentina (53.9%, a difference of 0.050%), South American Indian (53.9%, a difference of 0.11%), Taiwanese (53.9%, a difference of 0.13%), Immigrants from Singapore (53.9%, a difference of 0.14%), and Kiowa (53.9%, a difference of 0.16%).
| Demographics | Rating | Rank | 2 or more Vehicles in Household |
| Immigrants | Saudi Arabia | 11.3 /100 | #210 | Poor 54.2% |
| Immigrants | Hungary | 11.3 /100 | #211 | Poor 54.2% |
| Immigrants | Chile | 11.1 /100 | #212 | Poor 54.2% |
| Guatemalans | 9.6 /100 | #213 | Tragic 54.1% |
| Immigrants | Czechoslovakia | 9.4 /100 | #214 | Tragic 54.1% |
| Aleuts | 9.3 /100 | #215 | Tragic 54.1% |
| Immigrants | Western Asia | 9.3 /100 | #216 | Tragic 54.1% |
| Immigrants | Burma/Myanmar | 7.1 /100 | #217 | Tragic 53.9% |
| Immigrants | Argentina | 6.8 /100 | #218 | Tragic 53.9% |
| South American Indians | 6.5 /100 | #219 | Tragic 53.9% |
| Taiwanese | 6.3 /100 | #220 | Tragic 53.9% |
| Immigrants | Singapore | 6.3 /100 | #221 | Tragic 53.9% |
| Kiowa | 6.2 /100 | #222 | Tragic 53.9% |
| Immigrants | Bosnia and Herzegovina | 5.5 /100 | #223 | Tragic 53.8% |
| Brazilians | 5.3 /100 | #224 | Tragic 53.8% |
Demographics Similar to Luxembourgers by 2 or more Vehicles in Household
In terms of 2 or more vehicles in household, the demographic groups most similar to Luxembourgers are Bhutanese (59.1%, a difference of 0.030%), Chickasaw (59.0%, a difference of 0.11%), Afghan (59.0%, a difference of 0.11%), Celtic (59.2%, a difference of 0.18%), and Spaniard (59.2%, a difference of 0.19%).
| Demographics | Rating | Rank | 2 or more Vehicles in Household |
| Immigrants | India | 99.9 /100 | #48 | Exceptional 59.3% |
| Belgians | 99.9 /100 | #49 | Exceptional 59.3% |
| Choctaw | 99.9 /100 | #50 | Exceptional 59.3% |
| Spaniards | 99.9 /100 | #51 | Exceptional 59.2% |
| Immigrants | Laos | 99.9 /100 | #52 | Exceptional 59.2% |
| Celtics | 99.9 /100 | #53 | Exceptional 59.2% |
| Bhutanese | 99.9 /100 | #54 | Exceptional 59.1% |
| Luxembourgers | 99.9 /100 | #55 | Exceptional 59.1% |
| Chickasaw | 99.9 /100 | #56 | Exceptional 59.0% |
| Afghans | 99.9 /100 | #57 | Exceptional 59.0% |
| Immigrants | Scotland | 99.8 /100 | #58 | Exceptional 58.9% |
| Spanish Americans | 99.8 /100 | #59 | Exceptional 58.9% |
| French Canadians | 99.8 /100 | #60 | Exceptional 58.9% |
| Osage | 99.8 /100 | #61 | Exceptional 58.8% |
| Immigrants | Nonimmigrants | 99.8 /100 | #62 | Exceptional 58.8% |