Immigrants from Burma/Myanmar vs Cheyenne 2 or more Vehicles in Household
COMPARE
Immigrants from Burma/Myanmar
Cheyenne
2 or more Vehicles in Household
2 or more Vehicles in Household Comparison
Immigrants from Burma/Myanmar
Cheyenne
53.9%
2 OR MORE VEHICLES IN HOUSEHOLD
7.1/ 100
METRIC RATING
217th/ 347
METRIC RANK
54.3%
2 OR MORE VEHICLES IN HOUSEHOLD
13.6/ 100
METRIC RATING
205th/ 347
METRIC RANK
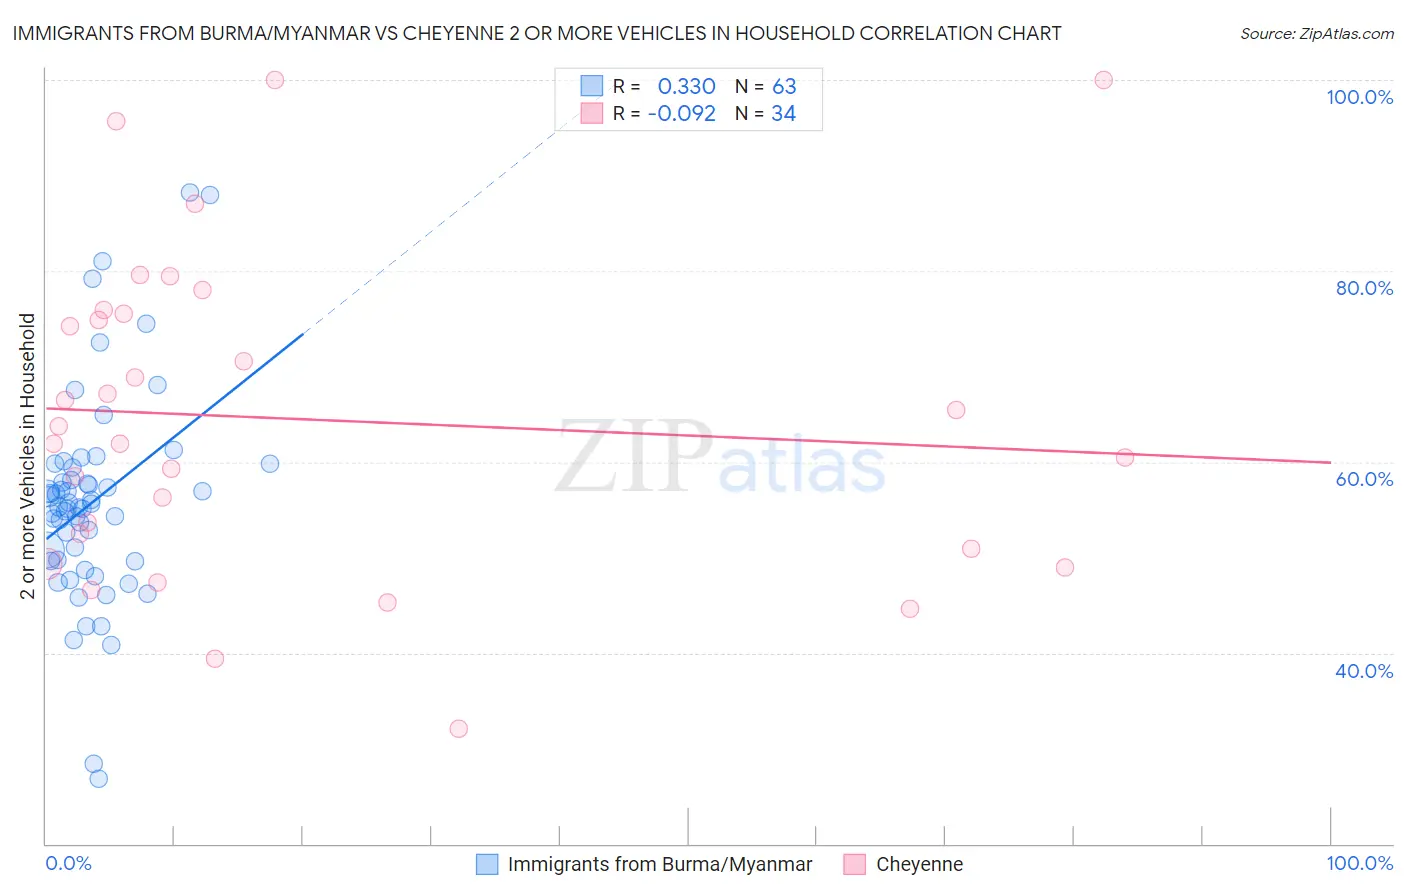
Immigrants from Burma/Myanmar vs Cheyenne 2 or more Vehicles in Household Correlation Chart
The statistical analysis conducted on geographies consisting of 172,281,201 people shows a mild positive correlation between the proportion of Immigrants from Burma/Myanmar and percentage of households with 2 or more vehicles available in the United States with a correlation coefficient (R) of 0.330 and weighted average of 53.9%. Similarly, the statistical analysis conducted on geographies consisting of 80,710,429 people shows a slight negative correlation between the proportion of Cheyenne and percentage of households with 2 or more vehicles available in the United States with a correlation coefficient (R) of -0.092 and weighted average of 54.3%, a difference of 0.74%.
2 or more Vehicles in Household Correlation Summary
| Measurement | Immigrants from Burma/Myanmar | Cheyenne |
| Minimum | 26.8% | 32.0% |
| Maximum | 88.2% | 100.0% |
| Range | 61.4% | 68.0% |
| Mean | 55.8% | 64.5% |
| Median | 55.3% | 62.8% |
| Interquartile 25% (IQ1) | 49.6% | 51.0% |
| Interquartile 75% (IQ3) | 59.4% | 75.5% |
| Interquartile Range (IQR) | 9.8% | 24.5% |
| Standard Deviation (Sample) | 11.1% | 16.8% |
| Standard Deviation (Population) | 11.0% | 16.5% |
Demographics Similar to Immigrants from Burma/Myanmar and Cheyenne by 2 or more Vehicles in Household
In terms of 2 or more vehicles in household, the demographic groups most similar to Immigrants from Burma/Myanmar are Immigrants from Argentina (53.9%, a difference of 0.050%), South American Indian (53.9%, a difference of 0.11%), Taiwanese (53.9%, a difference of 0.13%), Immigrants from Singapore (53.9%, a difference of 0.14%), and Aleut (54.1%, a difference of 0.29%). Similarly, the demographic groups most similar to Cheyenne are Immigrants from Belgium (54.3%, a difference of 0.010%), Immigrants from Latin America (54.3%, a difference of 0.050%), Immigrants from Peru (54.4%, a difference of 0.060%), Turkish (54.3%, a difference of 0.060%), and Immigrants from North Macedonia (54.4%, a difference of 0.10%).
| Demographics | Rating | Rank | 2 or more Vehicles in Household |
| Immigrants | Italy | 15.5 /100 | #201 | Poor 54.4% |
| Immigrants | North Macedonia | 14.9 /100 | #202 | Poor 54.4% |
| Immigrants | Peru | 14.3 /100 | #203 | Poor 54.4% |
| Immigrants | Belgium | 13.7 /100 | #204 | Poor 54.3% |
| Cheyenne | 13.6 /100 | #205 | Poor 54.3% |
| Immigrants | Latin America | 13.1 /100 | #206 | Poor 54.3% |
| Turks | 13.0 /100 | #207 | Poor 54.3% |
| Egyptians | 12.0 /100 | #208 | Poor 54.3% |
| Immigrants | Bulgaria | 12.0 /100 | #209 | Poor 54.3% |
| Immigrants | Saudi Arabia | 11.3 /100 | #210 | Poor 54.2% |
| Immigrants | Hungary | 11.3 /100 | #211 | Poor 54.2% |
| Immigrants | Chile | 11.1 /100 | #212 | Poor 54.2% |
| Guatemalans | 9.6 /100 | #213 | Tragic 54.1% |
| Immigrants | Czechoslovakia | 9.4 /100 | #214 | Tragic 54.1% |
| Aleuts | 9.3 /100 | #215 | Tragic 54.1% |
| Immigrants | Western Asia | 9.3 /100 | #216 | Tragic 54.1% |
| Immigrants | Burma/Myanmar | 7.1 /100 | #217 | Tragic 53.9% |
| Immigrants | Argentina | 6.8 /100 | #218 | Tragic 53.9% |
| South American Indians | 6.5 /100 | #219 | Tragic 53.9% |
| Taiwanese | 6.3 /100 | #220 | Tragic 53.9% |
| Immigrants | Singapore | 6.3 /100 | #221 | Tragic 53.9% |