Immigrants from Burma/Myanmar vs Serbian Bachelor's Degree
COMPARE
Immigrants from Burma/Myanmar
Serbian
Bachelor's Degree
Bachelor's Degree Comparison
Immigrants from Burma/Myanmar
Serbians
35.5%
BACHELOR'S DEGREE
7.3/ 100
METRIC RATING
225th/ 347
METRIC RANK
40.1%
BACHELOR'S DEGREE
92.4/ 100
METRIC RATING
129th/ 347
METRIC RANK
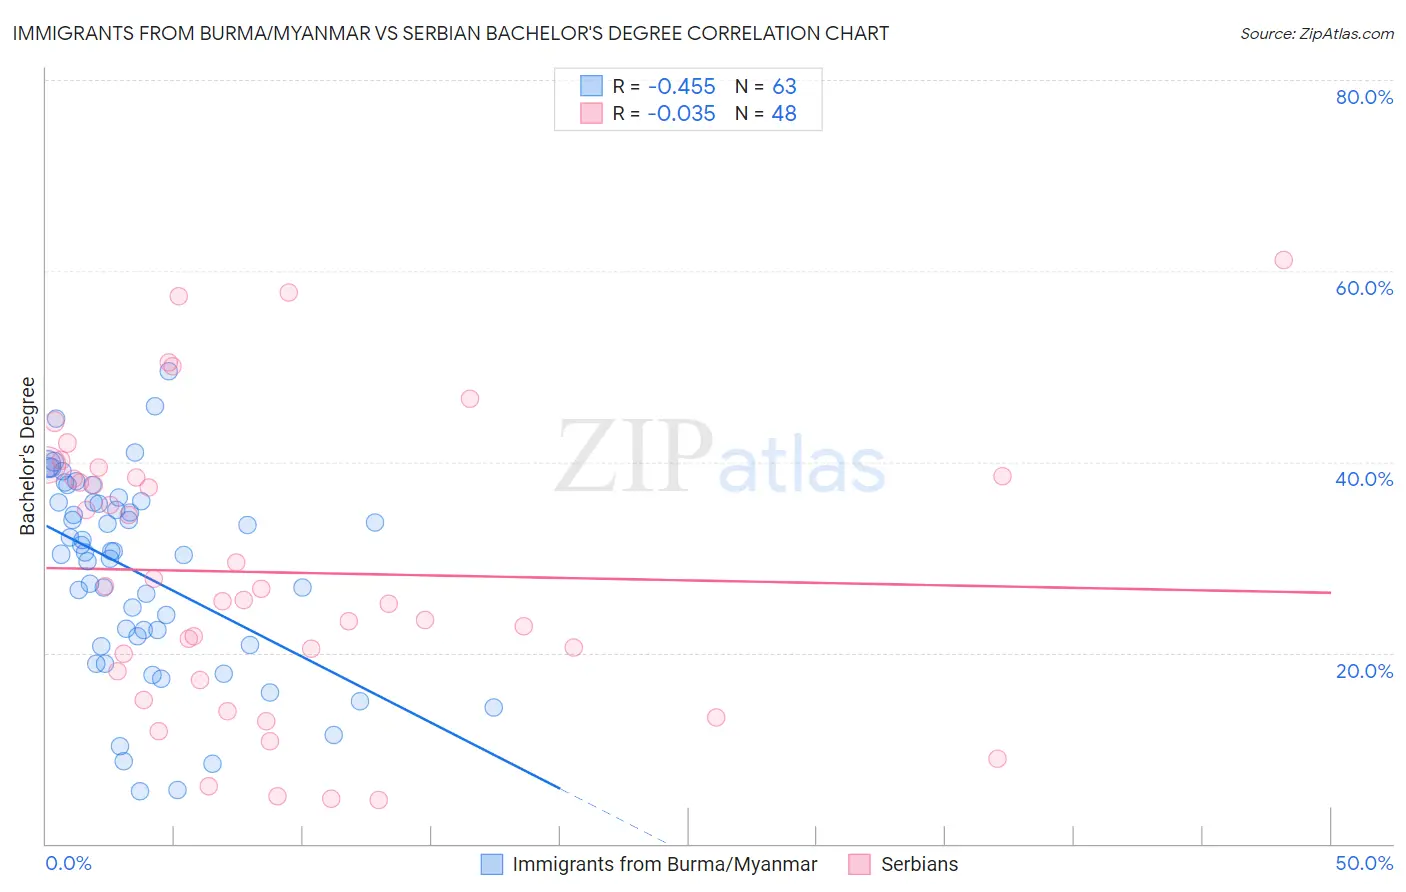
Immigrants from Burma/Myanmar vs Serbian Bachelor's Degree Correlation Chart
The statistical analysis conducted on geographies consisting of 172,337,344 people shows a moderate negative correlation between the proportion of Immigrants from Burma/Myanmar and percentage of population with at least bachelor's degree education in the United States with a correlation coefficient (R) of -0.455 and weighted average of 35.5%. Similarly, the statistical analysis conducted on geographies consisting of 267,632,791 people shows no correlation between the proportion of Serbians and percentage of population with at least bachelor's degree education in the United States with a correlation coefficient (R) of -0.035 and weighted average of 40.1%, a difference of 13.1%.
Bachelor's Degree Correlation Summary
| Measurement | Immigrants from Burma/Myanmar | Serbian |
| Minimum | 5.5% | 4.6% |
| Maximum | 49.5% | 61.2% |
| Range | 44.0% | 56.6% |
| Mean | 28.4% | 28.4% |
| Median | 30.5% | 26.1% |
| Interquartile 25% (IQ1) | 20.8% | 17.6% |
| Interquartile 75% (IQ3) | 35.8% | 38.4% |
| Interquartile Range (IQR) | 15.0% | 20.8% |
| Standard Deviation (Sample) | 10.3% | 14.7% |
| Standard Deviation (Population) | 10.2% | 14.6% |
Similar Demographics by Bachelor's Degree
Demographics Similar to Immigrants from Burma/Myanmar by Bachelor's Degree
In terms of bachelor's degree, the demographic groups most similar to Immigrants from Burma/Myanmar are Portuguese (35.5%, a difference of 0.040%), Immigrants from Barbados (35.5%, a difference of 0.070%), Ecuadorian (35.4%, a difference of 0.30%), French Canadian (35.6%, a difference of 0.35%), and Trinidadian and Tobagonian (35.7%, a difference of 0.52%).
| Demographics | Rating | Rank | Bachelor's Degree |
| Sub-Saharan Africans | 9.8 /100 | #218 | Tragic 35.8% |
| West Indians | 9.7 /100 | #219 | Tragic 35.8% |
| Spanish | 9.6 /100 | #220 | Tragic 35.8% |
| Dutch | 9.2 /100 | #221 | Tragic 35.7% |
| Trinidadians and Tobagonians | 8.8 /100 | #222 | Tragic 35.7% |
| French Canadians | 8.3 /100 | #223 | Tragic 35.6% |
| Immigrants | Barbados | 7.5 /100 | #224 | Tragic 35.5% |
| Immigrants | Burma/Myanmar | 7.3 /100 | #225 | Tragic 35.5% |
| Portuguese | 7.2 /100 | #226 | Tragic 35.5% |
| Ecuadorians | 6.6 /100 | #227 | Tragic 35.4% |
| Immigrants | Trinidad and Tobago | 6.0 /100 | #228 | Tragic 35.3% |
| Whites/Caucasians | 5.9 /100 | #229 | Tragic 35.3% |
| Immigrants | Grenada | 4.3 /100 | #230 | Tragic 35.0% |
| Immigrants | St. Vincent and the Grenadines | 4.3 /100 | #231 | Tragic 35.0% |
| Hmong | 3.4 /100 | #232 | Tragic 34.8% |
Demographics Similar to Serbians by Bachelor's Degree
In terms of bachelor's degree, the demographic groups most similar to Serbians are Sierra Leonean (40.1%, a difference of 0.070%), Italian (40.1%, a difference of 0.15%), Immigrants from Venezuela (40.2%, a difference of 0.17%), Immigrants from Jordan (40.3%, a difference of 0.35%), and Taiwanese (40.0%, a difference of 0.40%).
| Demographics | Rating | Rank | Bachelor's Degree |
| Immigrants | Albania | 94.4 /100 | #122 | Exceptional 40.4% |
| Lebanese | 94.3 /100 | #123 | Exceptional 40.4% |
| Immigrants | Eritrea | 94.3 /100 | #124 | Exceptional 40.4% |
| British | 94.2 /100 | #125 | Exceptional 40.4% |
| Immigrants | Eastern Africa | 94.1 /100 | #126 | Exceptional 40.4% |
| Immigrants | Jordan | 93.4 /100 | #127 | Exceptional 40.3% |
| Immigrants | Venezuela | 92.9 /100 | #128 | Exceptional 40.2% |
| Serbians | 92.4 /100 | #129 | Exceptional 40.1% |
| Sierra Leoneans | 92.2 /100 | #130 | Exceptional 40.1% |
| Italians | 91.9 /100 | #131 | Exceptional 40.1% |
| Taiwanese | 91.1 /100 | #132 | Exceptional 40.0% |
| Immigrants | Southern Europe | 91.1 /100 | #133 | Exceptional 40.0% |
| Assyrians/Chaldeans/Syriacs | 89.4 /100 | #134 | Excellent 39.8% |
| Luxembourgers | 89.1 /100 | #135 | Excellent 39.8% |
| Pakistanis | 88.2 /100 | #136 | Excellent 39.7% |