Immigrants from Burma/Myanmar vs Immigrants from Ghana 2 or more Vehicles in Household
COMPARE
Immigrants from Burma/Myanmar
Immigrants from Ghana
2 or more Vehicles in Household
2 or more Vehicles in Household Comparison
Immigrants from Burma/Myanmar
Immigrants from Ghana
53.9%
2 OR MORE VEHICLES IN HOUSEHOLD
7.1/ 100
METRIC RATING
217th/ 347
METRIC RANK
47.4%
2 OR MORE VEHICLES IN HOUSEHOLD
0.0/ 100
METRIC RATING
314th/ 347
METRIC RANK
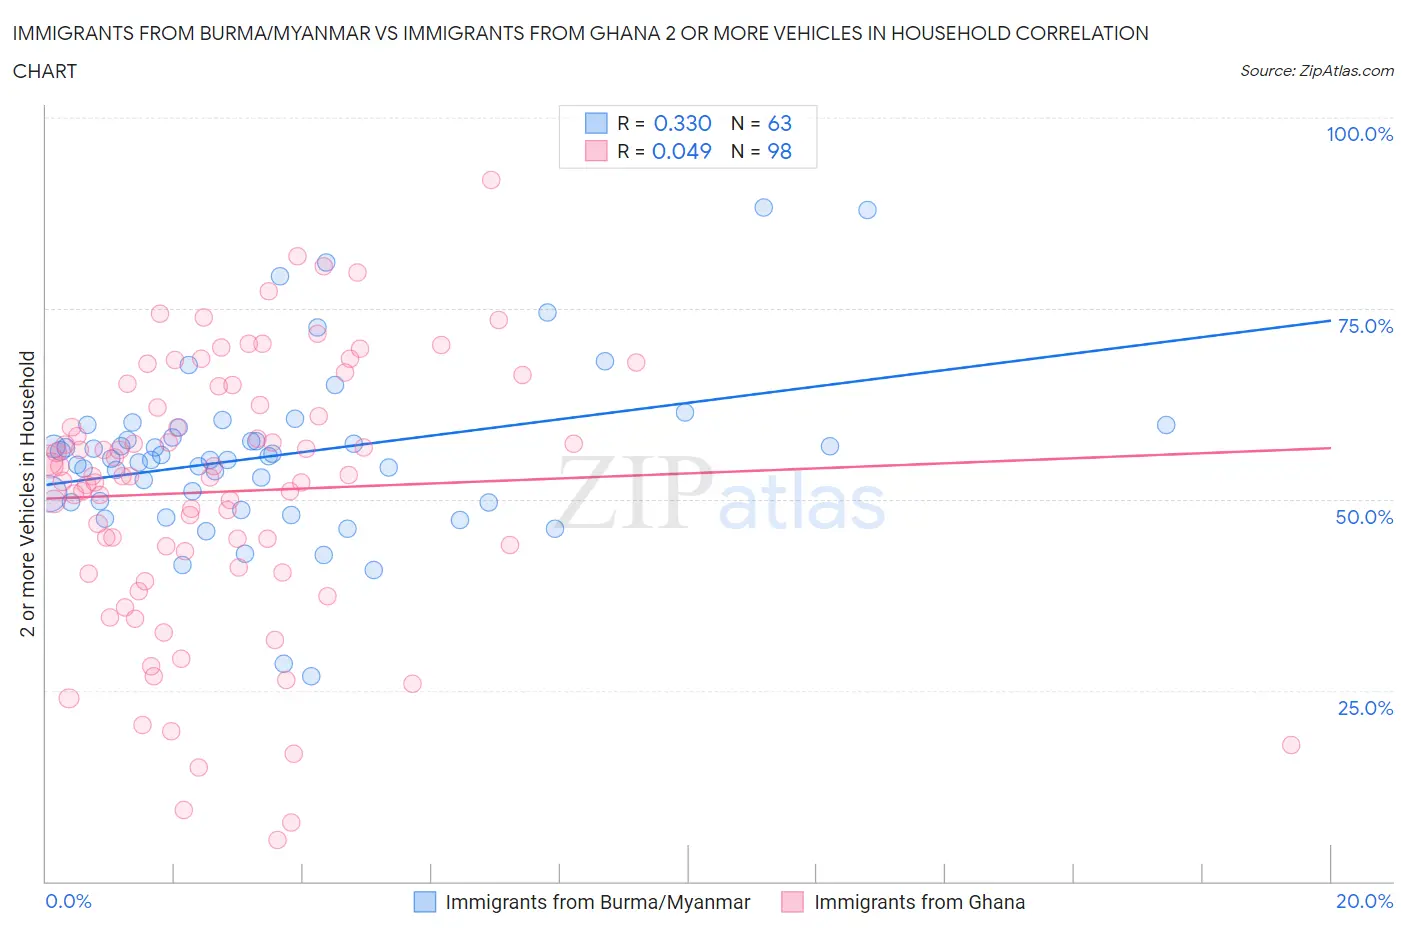
Immigrants from Burma/Myanmar vs Immigrants from Ghana 2 or more Vehicles in Household Correlation Chart
The statistical analysis conducted on geographies consisting of 172,281,201 people shows a mild positive correlation between the proportion of Immigrants from Burma/Myanmar and percentage of households with 2 or more vehicles available in the United States with a correlation coefficient (R) of 0.330 and weighted average of 53.9%. Similarly, the statistical analysis conducted on geographies consisting of 199,813,535 people shows no correlation between the proportion of Immigrants from Ghana and percentage of households with 2 or more vehicles available in the United States with a correlation coefficient (R) of 0.049 and weighted average of 47.4%, a difference of 13.9%.
2 or more Vehicles in Household Correlation Summary
| Measurement | Immigrants from Burma/Myanmar | Immigrants from Ghana |
| Minimum | 26.8% | 5.4% |
| Maximum | 88.2% | 91.9% |
| Range | 61.4% | 86.4% |
| Mean | 55.8% | 51.0% |
| Median | 55.3% | 53.0% |
| Interquartile 25% (IQ1) | 49.6% | 41.0% |
| Interquartile 75% (IQ3) | 59.4% | 62.3% |
| Interquartile Range (IQR) | 9.8% | 21.3% |
| Standard Deviation (Sample) | 11.1% | 17.5% |
| Standard Deviation (Population) | 11.0% | 17.5% |
Similar Demographics by 2 or more Vehicles in Household
Demographics Similar to Immigrants from Burma/Myanmar by 2 or more Vehicles in Household
In terms of 2 or more vehicles in household, the demographic groups most similar to Immigrants from Burma/Myanmar are Immigrants from Argentina (53.9%, a difference of 0.050%), South American Indian (53.9%, a difference of 0.11%), Taiwanese (53.9%, a difference of 0.13%), Immigrants from Singapore (53.9%, a difference of 0.14%), and Kiowa (53.9%, a difference of 0.16%).
| Demographics | Rating | Rank | 2 or more Vehicles in Household |
| Immigrants | Saudi Arabia | 11.3 /100 | #210 | Poor 54.2% |
| Immigrants | Hungary | 11.3 /100 | #211 | Poor 54.2% |
| Immigrants | Chile | 11.1 /100 | #212 | Poor 54.2% |
| Guatemalans | 9.6 /100 | #213 | Tragic 54.1% |
| Immigrants | Czechoslovakia | 9.4 /100 | #214 | Tragic 54.1% |
| Aleuts | 9.3 /100 | #215 | Tragic 54.1% |
| Immigrants | Western Asia | 9.3 /100 | #216 | Tragic 54.1% |
| Immigrants | Burma/Myanmar | 7.1 /100 | #217 | Tragic 53.9% |
| Immigrants | Argentina | 6.8 /100 | #218 | Tragic 53.9% |
| South American Indians | 6.5 /100 | #219 | Tragic 53.9% |
| Taiwanese | 6.3 /100 | #220 | Tragic 53.9% |
| Immigrants | Singapore | 6.3 /100 | #221 | Tragic 53.9% |
| Kiowa | 6.2 /100 | #222 | Tragic 53.9% |
| Immigrants | Bosnia and Herzegovina | 5.5 /100 | #223 | Tragic 53.8% |
| Brazilians | 5.3 /100 | #224 | Tragic 53.8% |
Demographics Similar to Immigrants from Ghana by 2 or more Vehicles in Household
In terms of 2 or more vehicles in household, the demographic groups most similar to Immigrants from Ghana are U.S. Virgin Islander (47.5%, a difference of 0.22%), Haitian (47.6%, a difference of 0.40%), Puerto Rican (47.1%, a difference of 0.57%), Immigrants from Belarus (47.9%, a difference of 1.1%), and Ghanaian (48.0%, a difference of 1.3%).
| Demographics | Rating | Rank | 2 or more Vehicles in Household |
| Hopi | 0.0 /100 | #307 | Tragic 49.0% |
| Albanians | 0.0 /100 | #308 | Tragic 49.0% |
| Moroccans | 0.0 /100 | #309 | Tragic 48.8% |
| Ghanaians | 0.0 /100 | #310 | Tragic 48.0% |
| Immigrants | Belarus | 0.0 /100 | #311 | Tragic 47.9% |
| Haitians | 0.0 /100 | #312 | Tragic 47.6% |
| U.S. Virgin Islanders | 0.0 /100 | #313 | Tragic 47.5% |
| Immigrants | Ghana | 0.0 /100 | #314 | Tragic 47.4% |
| Puerto Ricans | 0.0 /100 | #315 | Tragic 47.1% |
| Cape Verdeans | 0.0 /100 | #316 | Tragic 46.8% |
| Immigrants | Haiti | 0.0 /100 | #317 | Tragic 46.5% |
| Immigrants | Albania | 0.0 /100 | #318 | Tragic 46.0% |
| Jamaicans | 0.0 /100 | #319 | Tragic 45.8% |
| Soviet Union | 0.0 /100 | #320 | Tragic 45.7% |
| Immigrants | Jamaica | 0.0 /100 | #321 | Tragic 44.5% |