Immigrants from Burma/Myanmar vs Serbian Median Male Earnings
COMPARE
Immigrants from Burma/Myanmar
Serbian
Median Male Earnings
Median Male Earnings Comparison
Immigrants from Burma/Myanmar
Serbians
$50,298
MEDIAN MALE EARNINGS
1.6/ 100
METRIC RATING
249th/ 347
METRIC RANK
$57,975
MEDIAN MALE EARNINGS
96.8/ 100
METRIC RATING
107th/ 347
METRIC RANK
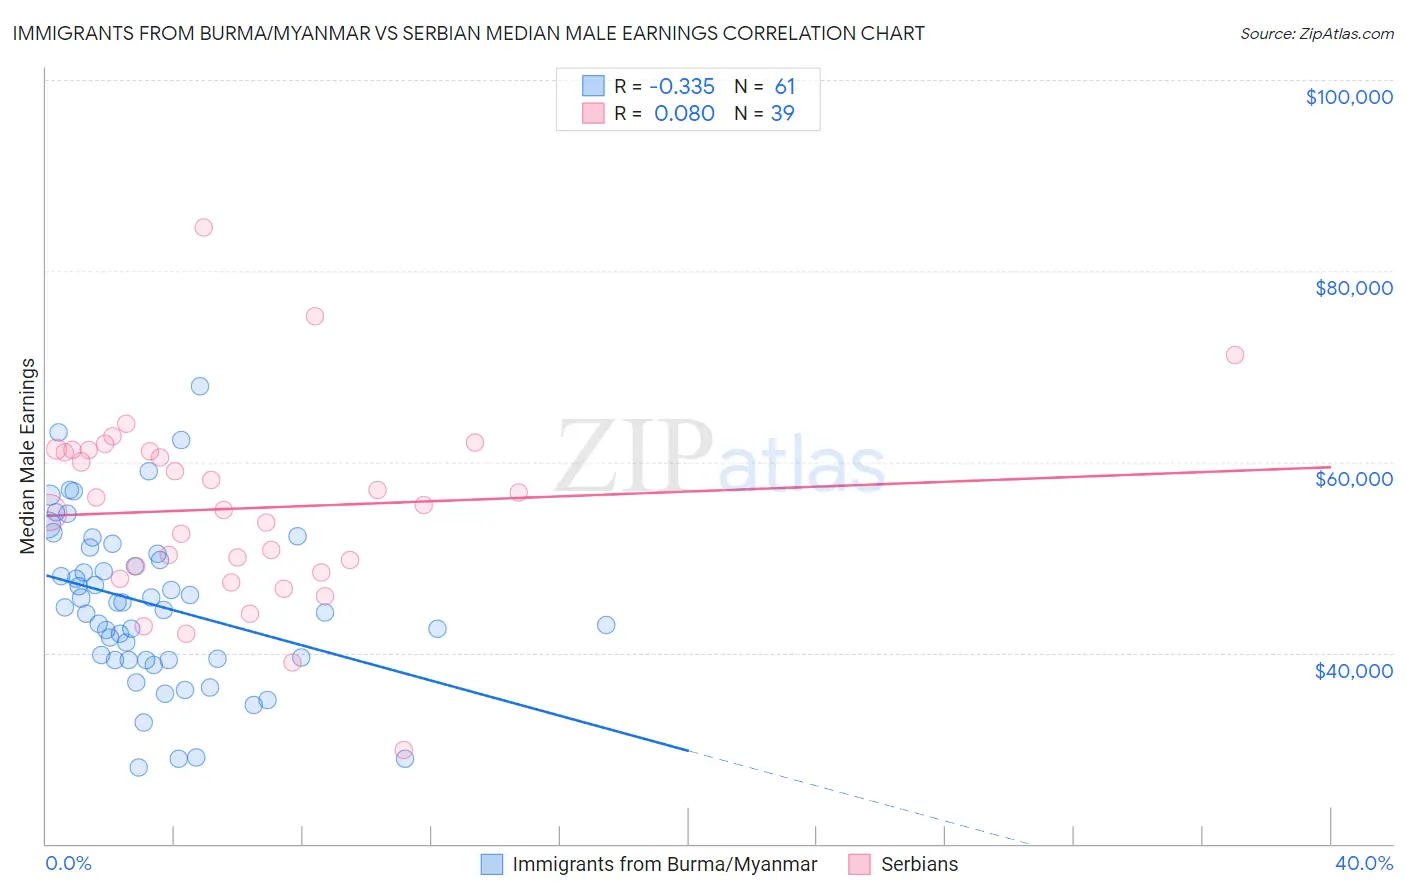
Immigrants from Burma/Myanmar vs Serbian Median Male Earnings Correlation Chart
The statistical analysis conducted on geographies consisting of 172,350,242 people shows a mild negative correlation between the proportion of Immigrants from Burma/Myanmar and median male earnings in the United States with a correlation coefficient (R) of -0.335 and weighted average of $50,298. Similarly, the statistical analysis conducted on geographies consisting of 267,612,597 people shows a slight positive correlation between the proportion of Serbians and median male earnings in the United States with a correlation coefficient (R) of 0.080 and weighted average of $57,975, a difference of 15.3%.
Median Male Earnings Correlation Summary
| Measurement | Immigrants from Burma/Myanmar | Serbian |
| Minimum | $27,990 | $29,881 |
| Maximum | $67,960 | $84,510 |
| Range | $39,970 | $54,629 |
| Mean | $45,043 | $55,134 |
| Median | $44,781 | $55,532 |
| Interquartile 25% (IQ1) | $39,264 | $48,361 |
| Interquartile 75% (IQ3) | $50,701 | $61,216 |
| Interquartile Range (IQR) | $11,437 | $12,855 |
| Standard Deviation (Sample) | $8,603 | $10,037 |
| Standard Deviation (Population) | $8,532 | $9,908 |
Similar Demographics by Median Male Earnings
Demographics Similar to Immigrants from Burma/Myanmar by Median Male Earnings
In terms of median male earnings, the demographic groups most similar to Immigrants from Burma/Myanmar are Osage ($50,292, a difference of 0.010%), Immigrants from Grenada ($50,279, a difference of 0.040%), Immigrants from Guyana ($50,321, a difference of 0.050%), Subsaharan African ($50,408, a difference of 0.22%), and Immigrants from Ecuador ($50,474, a difference of 0.35%).
| Demographics | Rating | Rank | Median Male Earnings |
| Guyanese | 2.2 /100 | #242 | Tragic $50,613 |
| French American Indians | 2.2 /100 | #243 | Tragic $50,611 |
| Houma | 2.0 /100 | #244 | Tragic $50,547 |
| Hawaiians | 1.9 /100 | #245 | Tragic $50,488 |
| Immigrants | Ecuador | 1.9 /100 | #246 | Tragic $50,474 |
| Sub-Saharan Africans | 1.8 /100 | #247 | Tragic $50,408 |
| Immigrants | Guyana | 1.6 /100 | #248 | Tragic $50,321 |
| Immigrants | Burma/Myanmar | 1.6 /100 | #249 | Tragic $50,298 |
| Osage | 1.6 /100 | #250 | Tragic $50,292 |
| Immigrants | Grenada | 1.6 /100 | #251 | Tragic $50,279 |
| Immigrants | Cabo Verde | 1.2 /100 | #252 | Tragic $50,009 |
| German Russians | 1.1 /100 | #253 | Tragic $49,924 |
| Senegalese | 1.0 /100 | #254 | Tragic $49,774 |
| Alaskan Athabascans | 0.9 /100 | #255 | Tragic $49,748 |
| Alaska Natives | 0.9 /100 | #256 | Tragic $49,711 |
Demographics Similar to Serbians by Median Male Earnings
In terms of median male earnings, the demographic groups most similar to Serbians are Immigrants from Northern Africa ($58,008, a difference of 0.060%), Immigrants from Uzbekistan ($57,941, a difference of 0.060%), British ($57,890, a difference of 0.15%), Armenian ($58,134, a difference of 0.27%), and Immigrants from Western Asia ($58,131, a difference of 0.27%).
| Demographics | Rating | Rank | Median Male Earnings |
| Assyrians/Chaldeans/Syriacs | 97.9 /100 | #100 | Exceptional $58,437 |
| Immigrants | Brazil | 97.7 /100 | #101 | Exceptional $58,324 |
| Syrians | 97.4 /100 | #102 | Exceptional $58,187 |
| Poles | 97.3 /100 | #103 | Exceptional $58,139 |
| Armenians | 97.3 /100 | #104 | Exceptional $58,134 |
| Immigrants | Western Asia | 97.3 /100 | #105 | Exceptional $58,131 |
| Immigrants | Northern Africa | 96.9 /100 | #106 | Exceptional $58,008 |
| Serbians | 96.8 /100 | #107 | Exceptional $57,975 |
| Immigrants | Uzbekistan | 96.7 /100 | #108 | Exceptional $57,941 |
| British | 96.5 /100 | #109 | Exceptional $57,890 |
| Palestinians | 96.2 /100 | #110 | Exceptional $57,778 |
| Europeans | 95.6 /100 | #111 | Exceptional $57,637 |
| Immigrants | Afghanistan | 95.4 /100 | #112 | Exceptional $57,582 |
| Carpatho Rusyns | 95.3 /100 | #113 | Exceptional $57,572 |
| Immigrants | Kuwait | 95.3 /100 | #114 | Exceptional $57,562 |