Immigrants from Hong Kong vs Serbian 2 or more Vehicles in Household
COMPARE
Immigrants from Hong Kong
Serbian
2 or more Vehicles in Household
2 or more Vehicles in Household Comparison
Immigrants from Hong Kong
Serbians
52.6%
2 OR MORE VEHICLES IN HOUSEHOLD
0.6/ 100
METRIC RATING
257th/ 347
METRIC RANK
56.1%
2 OR MORE VEHICLES IN HOUSEHOLD
80.3/ 100
METRIC RATING
147th/ 347
METRIC RANK
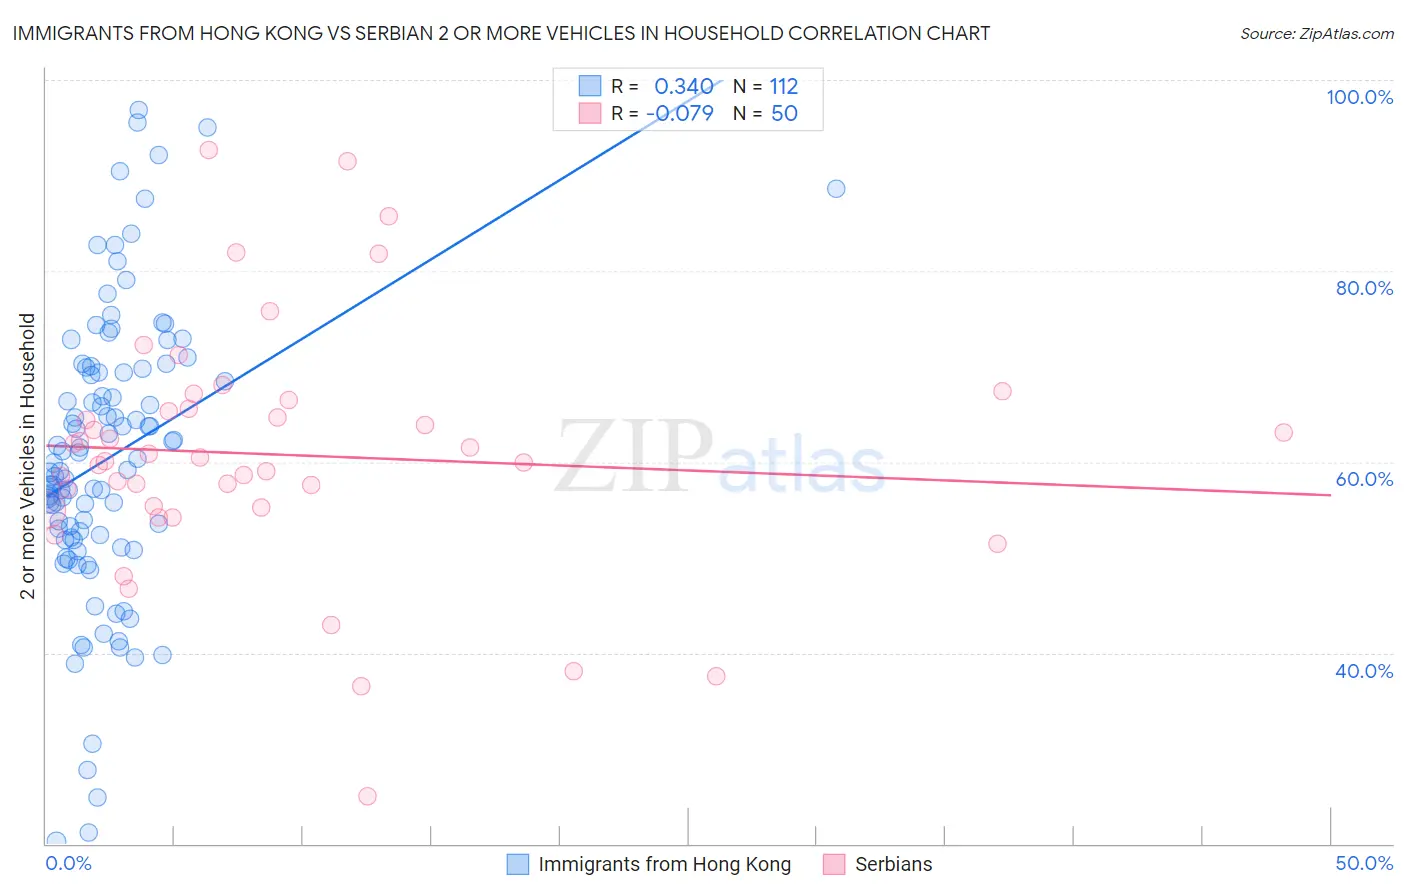
Immigrants from Hong Kong vs Serbian 2 or more Vehicles in Household Correlation Chart
The statistical analysis conducted on geographies consisting of 253,902,062 people shows a mild positive correlation between the proportion of Immigrants from Hong Kong and percentage of households with 2 or more vehicles available in the United States with a correlation coefficient (R) of 0.340 and weighted average of 52.6%. Similarly, the statistical analysis conducted on geographies consisting of 267,548,486 people shows a slight negative correlation between the proportion of Serbians and percentage of households with 2 or more vehicles available in the United States with a correlation coefficient (R) of -0.079 and weighted average of 56.1%, a difference of 6.8%.
2 or more Vehicles in Household Correlation Summary
| Measurement | Immigrants from Hong Kong | Serbian |
| Minimum | 20.2% | 25.0% |
| Maximum | 96.9% | 92.6% |
| Range | 76.6% | 67.6% |
| Mean | 60.4% | 60.8% |
| Median | 59.5% | 60.2% |
| Interquartile 25% (IQ1) | 52.0% | 55.2% |
| Interquartile 75% (IQ3) | 69.6% | 65.6% |
| Interquartile Range (IQR) | 17.6% | 10.4% |
| Standard Deviation (Sample) | 15.1% | 12.9% |
| Standard Deviation (Population) | 15.0% | 12.8% |
Similar Demographics by 2 or more Vehicles in Household
Demographics Similar to Immigrants from Hong Kong by 2 or more Vehicles in Household
In terms of 2 or more vehicles in household, the demographic groups most similar to Immigrants from Hong Kong are Central American Indian (52.5%, a difference of 0.10%), Immigrants from Eritrea (52.6%, a difference of 0.14%), Alsatian (52.5%, a difference of 0.14%), Uruguayan (52.7%, a difference of 0.18%), and Immigrants from Bahamas (52.5%, a difference of 0.20%).
| Demographics | Rating | Rank | 2 or more Vehicles in Household |
| Mongolians | 1.0 /100 | #250 | Tragic 52.8% |
| Immigrants | Sudan | 1.0 /100 | #251 | Tragic 52.8% |
| Immigrants | Portugal | 1.0 /100 | #252 | Tragic 52.8% |
| Nigerians | 0.9 /100 | #253 | Tragic 52.8% |
| Immigrants | Malaysia | 0.8 /100 | #254 | Tragic 52.7% |
| Uruguayans | 0.7 /100 | #255 | Tragic 52.7% |
| Immigrants | Eritrea | 0.7 /100 | #256 | Tragic 52.6% |
| Immigrants | Hong Kong | 0.6 /100 | #257 | Tragic 52.6% |
| Central American Indians | 0.6 /100 | #258 | Tragic 52.5% |
| Alsatians | 0.6 /100 | #259 | Tragic 52.5% |
| Immigrants | Bahamas | 0.5 /100 | #260 | Tragic 52.5% |
| Immigrants | Australia | 0.5 /100 | #261 | Tragic 52.4% |
| Immigrants | Northern Africa | 0.4 /100 | #262 | Tragic 52.3% |
| Immigrants | Southern Europe | 0.4 /100 | #263 | Tragic 52.3% |
| Immigrants | Latvia | 0.4 /100 | #264 | Tragic 52.2% |
Demographics Similar to Serbians by 2 or more Vehicles in Household
In terms of 2 or more vehicles in household, the demographic groups most similar to Serbians are Immigrants from Moldova (56.1%, a difference of 0.0%), Chilean (56.1%, a difference of 0.010%), Venezuelan (56.1%, a difference of 0.020%), Nicaraguan (56.1%, a difference of 0.030%), and Syrian (56.2%, a difference of 0.060%).
| Demographics | Rating | Rank | 2 or more Vehicles in Household |
| Latvians | 83.6 /100 | #140 | Excellent 56.2% |
| Immigrants | Cambodia | 83.6 /100 | #141 | Excellent 56.2% |
| South Africans | 83.1 /100 | #142 | Excellent 56.2% |
| Seminole | 81.7 /100 | #143 | Excellent 56.2% |
| Immigrants | Syria | 81.4 /100 | #144 | Excellent 56.2% |
| Syrians | 81.2 /100 | #145 | Excellent 56.2% |
| Venezuelans | 80.7 /100 | #146 | Excellent 56.1% |
| Serbians | 80.3 /100 | #147 | Excellent 56.1% |
| Immigrants | Moldova | 80.2 /100 | #148 | Excellent 56.1% |
| Chileans | 80.2 /100 | #149 | Excellent 56.1% |
| Nicaraguans | 79.9 /100 | #150 | Good 56.1% |
| Immigrants | Northern Europe | 78.7 /100 | #151 | Good 56.1% |
| Immigrants | Pakistan | 78.1 /100 | #152 | Good 56.1% |
| Lumbee | 71.9 /100 | #153 | Good 55.9% |
| Ukrainians | 70.8 /100 | #154 | Good 55.8% |