Immigrants from Burma/Myanmar vs Dutch West Indian 2 or more Vehicles in Household
COMPARE
Immigrants from Burma/Myanmar
Dutch West Indian
2 or more Vehicles in Household
2 or more Vehicles in Household Comparison
Immigrants from Burma/Myanmar
Dutch West Indians
53.9%
2 OR MORE VEHICLES IN HOUSEHOLD
7.1/ 100
METRIC RATING
217th/ 347
METRIC RANK
55.6%
2 OR MORE VEHICLES IN HOUSEHOLD
59.8/ 100
METRIC RATING
164th/ 347
METRIC RANK
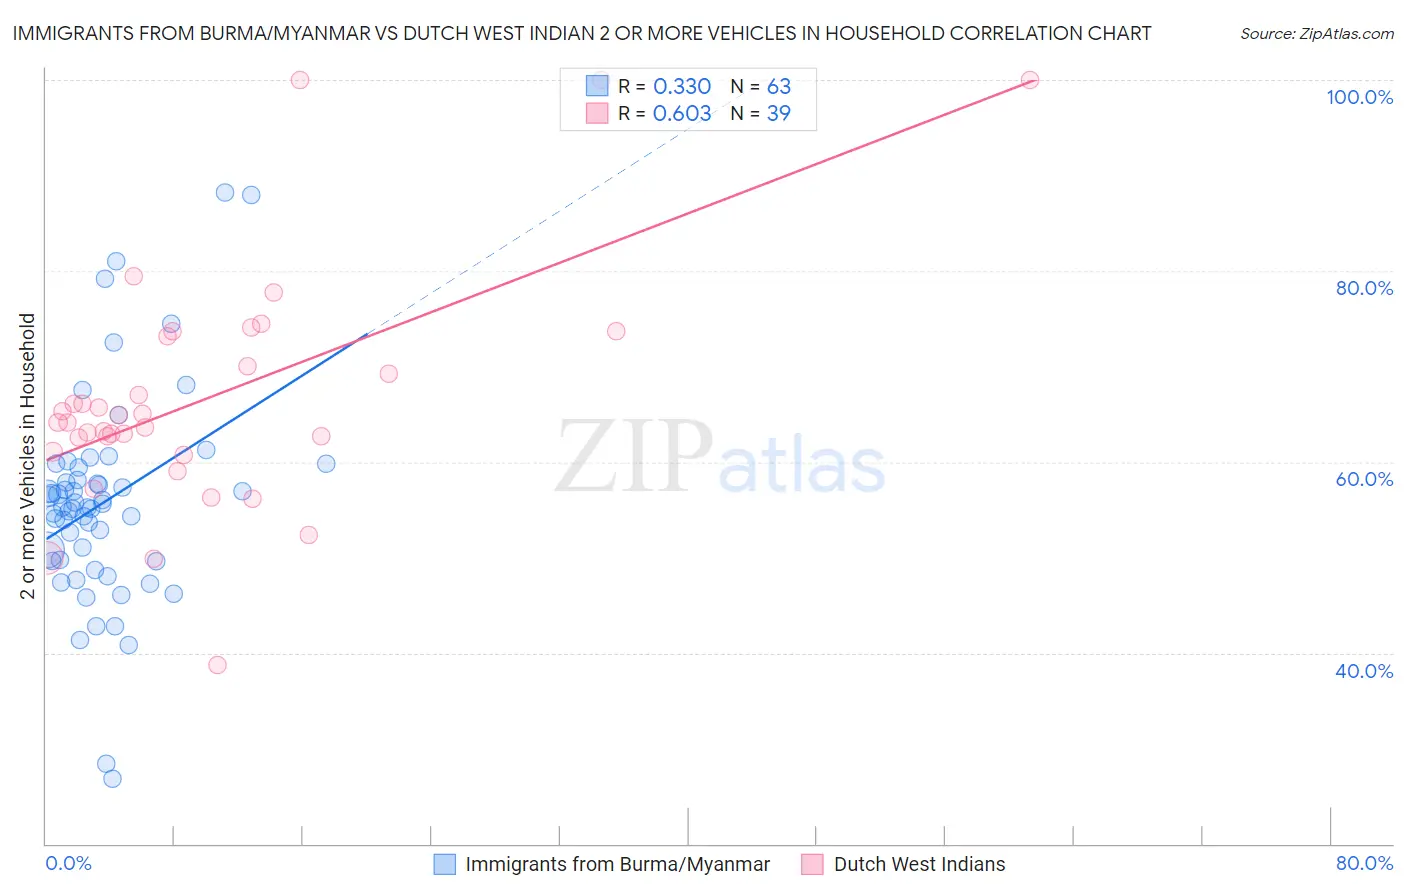
Immigrants from Burma/Myanmar vs Dutch West Indian 2 or more Vehicles in Household Correlation Chart
The statistical analysis conducted on geographies consisting of 172,281,201 people shows a mild positive correlation between the proportion of Immigrants from Burma/Myanmar and percentage of households with 2 or more vehicles available in the United States with a correlation coefficient (R) of 0.330 and weighted average of 53.9%. Similarly, the statistical analysis conducted on geographies consisting of 85,766,577 people shows a significant positive correlation between the proportion of Dutch West Indians and percentage of households with 2 or more vehicles available in the United States with a correlation coefficient (R) of 0.603 and weighted average of 55.6%, a difference of 3.0%.
2 or more Vehicles in Household Correlation Summary
| Measurement | Immigrants from Burma/Myanmar | Dutch West Indian |
| Minimum | 26.8% | 38.7% |
| Maximum | 88.2% | 100.0% |
| Range | 61.4% | 61.3% |
| Mean | 55.8% | 66.6% |
| Median | 55.3% | 64.1% |
| Interquartile 25% (IQ1) | 49.6% | 61.1% |
| Interquartile 75% (IQ3) | 59.4% | 73.2% |
| Interquartile Range (IQR) | 9.8% | 12.1% |
| Standard Deviation (Sample) | 11.1% | 12.6% |
| Standard Deviation (Population) | 11.0% | 12.4% |
Similar Demographics by 2 or more Vehicles in Household
Demographics Similar to Immigrants from Burma/Myanmar by 2 or more Vehicles in Household
In terms of 2 or more vehicles in household, the demographic groups most similar to Immigrants from Burma/Myanmar are Immigrants from Argentina (53.9%, a difference of 0.050%), South American Indian (53.9%, a difference of 0.11%), Taiwanese (53.9%, a difference of 0.13%), Immigrants from Singapore (53.9%, a difference of 0.14%), and Kiowa (53.9%, a difference of 0.16%).
| Demographics | Rating | Rank | 2 or more Vehicles in Household |
| Immigrants | Saudi Arabia | 11.3 /100 | #210 | Poor 54.2% |
| Immigrants | Hungary | 11.3 /100 | #211 | Poor 54.2% |
| Immigrants | Chile | 11.1 /100 | #212 | Poor 54.2% |
| Guatemalans | 9.6 /100 | #213 | Tragic 54.1% |
| Immigrants | Czechoslovakia | 9.4 /100 | #214 | Tragic 54.1% |
| Aleuts | 9.3 /100 | #215 | Tragic 54.1% |
| Immigrants | Western Asia | 9.3 /100 | #216 | Tragic 54.1% |
| Immigrants | Burma/Myanmar | 7.1 /100 | #217 | Tragic 53.9% |
| Immigrants | Argentina | 6.8 /100 | #218 | Tragic 53.9% |
| South American Indians | 6.5 /100 | #219 | Tragic 53.9% |
| Taiwanese | 6.3 /100 | #220 | Tragic 53.9% |
| Immigrants | Singapore | 6.3 /100 | #221 | Tragic 53.9% |
| Kiowa | 6.2 /100 | #222 | Tragic 53.9% |
| Immigrants | Bosnia and Herzegovina | 5.5 /100 | #223 | Tragic 53.8% |
| Brazilians | 5.3 /100 | #224 | Tragic 53.8% |
Demographics Similar to Dutch West Indians by 2 or more Vehicles in Household
In terms of 2 or more vehicles in household, the demographic groups most similar to Dutch West Indians are Immigrants from Zimbabwe (55.6%, a difference of 0.010%), Immigrants from El Salvador (55.6%, a difference of 0.020%), German Russian (55.6%, a difference of 0.040%), Colville (55.6%, a difference of 0.050%), and Immigrants from Sri Lanka (55.5%, a difference of 0.060%).
| Demographics | Rating | Rank | 2 or more Vehicles in Household |
| Immigrants | Kuwait | 70.2 /100 | #157 | Good 55.8% |
| Tlingit-Haida | 68.5 /100 | #158 | Good 55.8% |
| Paiute | 68.0 /100 | #159 | Good 55.8% |
| Crow | 67.0 /100 | #160 | Good 55.7% |
| Colville | 61.1 /100 | #161 | Good 55.6% |
| German Russians | 60.9 /100 | #162 | Good 55.6% |
| Immigrants | Zimbabwe | 60.2 /100 | #163 | Good 55.6% |
| Dutch West Indians | 59.8 /100 | #164 | Average 55.6% |
| Immigrants | El Salvador | 59.4 /100 | #165 | Average 55.6% |
| Immigrants | Sri Lanka | 58.3 /100 | #166 | Average 55.5% |
| Kenyans | 58.1 /100 | #167 | Average 55.5% |
| French American Indians | 56.7 /100 | #168 | Average 55.5% |
| Immigrants | Austria | 56.3 /100 | #169 | Average 55.5% |
| Romanians | 55.8 /100 | #170 | Average 55.5% |
| Immigrants | Costa Rica | 54.4 /100 | #171 | Average 55.4% |