Immigrants from Belgium vs Menominee Family Households with Children
COMPARE
Immigrants from Belgium
Menominee
Family Households with Children
Family Households with Children Comparison
Immigrants from Belgium
Menominee
26.7%
FAMILY HOUSEHOLDS WITH CHILDREN
0.9/ 100
METRIC RATING
268th/ 347
METRIC RANK
27.6%
FAMILY HOUSEHOLDS WITH CHILDREN
78.9/ 100
METRIC RATING
149th/ 347
METRIC RANK
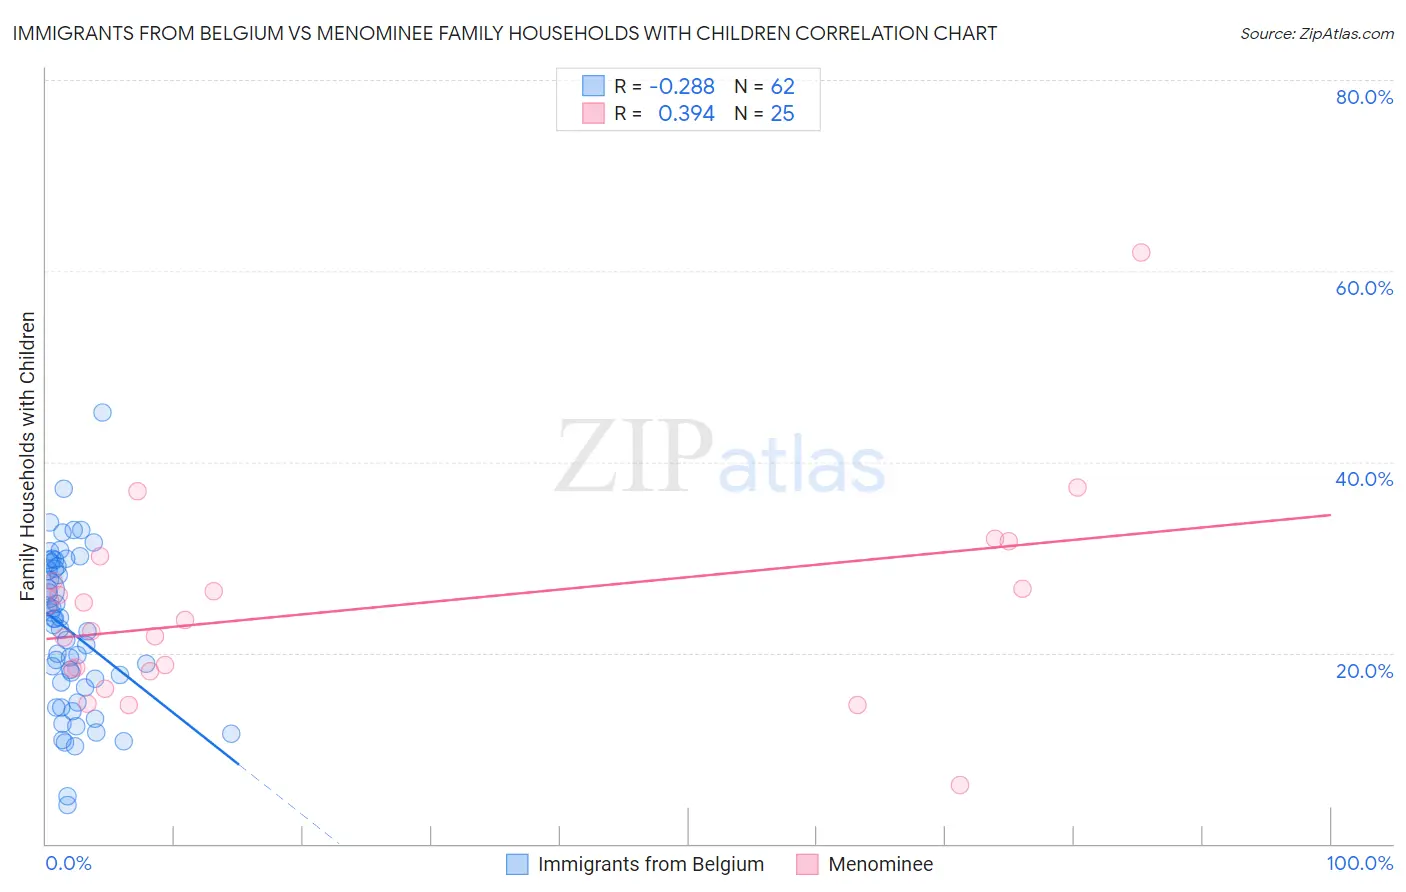
Immigrants from Belgium vs Menominee Family Households with Children Correlation Chart
The statistical analysis conducted on geographies consisting of 146,676,152 people shows a weak negative correlation between the proportion of Immigrants from Belgium and percentage of family households with children in the United States with a correlation coefficient (R) of -0.288 and weighted average of 26.7%. Similarly, the statistical analysis conducted on geographies consisting of 45,777,730 people shows a mild positive correlation between the proportion of Menominee and percentage of family households with children in the United States with a correlation coefficient (R) of 0.394 and weighted average of 27.6%, a difference of 3.4%.
Family Households with Children Correlation Summary
| Measurement | Immigrants from Belgium | Menominee |
| Minimum | 4.0% | 6.1% |
| Maximum | 45.1% | 61.9% |
| Range | 41.1% | 55.8% |
| Mean | 22.2% | 24.6% |
| Median | 22.7% | 23.4% |
| Interquartile 25% (IQ1) | 16.3% | 18.2% |
| Interquartile 75% (IQ3) | 29.1% | 28.8% |
| Interquartile Range (IQR) | 12.8% | 10.6% |
| Standard Deviation (Sample) | 8.3% | 10.7% |
| Standard Deviation (Population) | 8.2% | 10.5% |
Similar Demographics by Family Households with Children
Demographics Similar to Immigrants from Belgium by Family Households with Children
In terms of family households with children, the demographic groups most similar to Immigrants from Belgium are Maltese (26.7%, a difference of 0.010%), Immigrants from Uzbekistan (26.7%, a difference of 0.010%), Taiwanese (26.7%, a difference of 0.020%), Chippewa (26.7%, a difference of 0.020%), and Immigrants from Denmark (26.7%, a difference of 0.040%).
| Demographics | Rating | Rank | Family Households with Children |
| Immigrants | Belarus | 1.1 /100 | #261 | Tragic 26.8% |
| Immigrants | Russia | 1.0 /100 | #262 | Tragic 26.8% |
| Immigrants | North Macedonia | 1.0 /100 | #263 | Tragic 26.7% |
| Taiwanese | 0.9 /100 | #264 | Tragic 26.7% |
| Chippewa | 0.9 /100 | #265 | Tragic 26.7% |
| Maltese | 0.9 /100 | #266 | Tragic 26.7% |
| Immigrants | Uzbekistan | 0.9 /100 | #267 | Tragic 26.7% |
| Immigrants | Belgium | 0.9 /100 | #268 | Tragic 26.7% |
| Immigrants | Denmark | 0.8 /100 | #269 | Tragic 26.7% |
| Immigrants | Zaire | 0.7 /100 | #270 | Tragic 26.7% |
| French | 0.7 /100 | #271 | Tragic 26.7% |
| Somalis | 0.7 /100 | #272 | Tragic 26.7% |
| Immigrants | Hungary | 0.6 /100 | #273 | Tragic 26.7% |
| Eastern Europeans | 0.6 /100 | #274 | Tragic 26.7% |
| Immigrants | Northern Europe | 0.5 /100 | #275 | Tragic 26.7% |
Demographics Similar to Menominee by Family Households with Children
In terms of family households with children, the demographic groups most similar to Menominee are Osage (27.6%, a difference of 0.0%), Immigrants from Moldova (27.6%, a difference of 0.010%), Argentinean (27.6%, a difference of 0.010%), Brazilian (27.7%, a difference of 0.020%), and Immigrants from Chile (27.7%, a difference of 0.020%).
| Demographics | Rating | Rank | Family Households with Children |
| Swiss | 81.4 /100 | #142 | Excellent 27.7% |
| Immigrants | Eastern Africa | 80.2 /100 | #143 | Excellent 27.7% |
| Brazilians | 79.6 /100 | #144 | Good 27.7% |
| Immigrants | Chile | 79.5 /100 | #145 | Good 27.7% |
| Basques | 79.5 /100 | #146 | Good 27.7% |
| Immigrants | Moldova | 79.1 /100 | #147 | Good 27.6% |
| Osage | 79.0 /100 | #148 | Good 27.6% |
| Menominee | 78.9 /100 | #149 | Good 27.6% |
| Argentineans | 78.5 /100 | #150 | Good 27.6% |
| Portuguese | 77.8 /100 | #151 | Good 27.6% |
| Ethiopians | 77.0 /100 | #152 | Good 27.6% |
| Immigrants | Cabo Verde | 75.6 /100 | #153 | Good 27.6% |
| Icelanders | 75.3 /100 | #154 | Good 27.6% |
| Comanche | 74.8 /100 | #155 | Good 27.6% |
| Hungarians | 74.6 /100 | #156 | Good 27.6% |