Immigrants from Yemen vs Menominee 2 or more Vehicles in Household
COMPARE
Immigrants from Yemen
Menominee
2 or more Vehicles in Household
2 or more Vehicles in Household Comparison
Immigrants from Yemen
Menominee
42.8%
2 OR MORE VEHICLES IN HOUSEHOLD
0.0/ 100
METRIC RATING
327th/ 347
METRIC RANK
55.3%
2 OR MORE VEHICLES IN HOUSEHOLD
46.2/ 100
METRIC RATING
177th/ 347
METRIC RANK
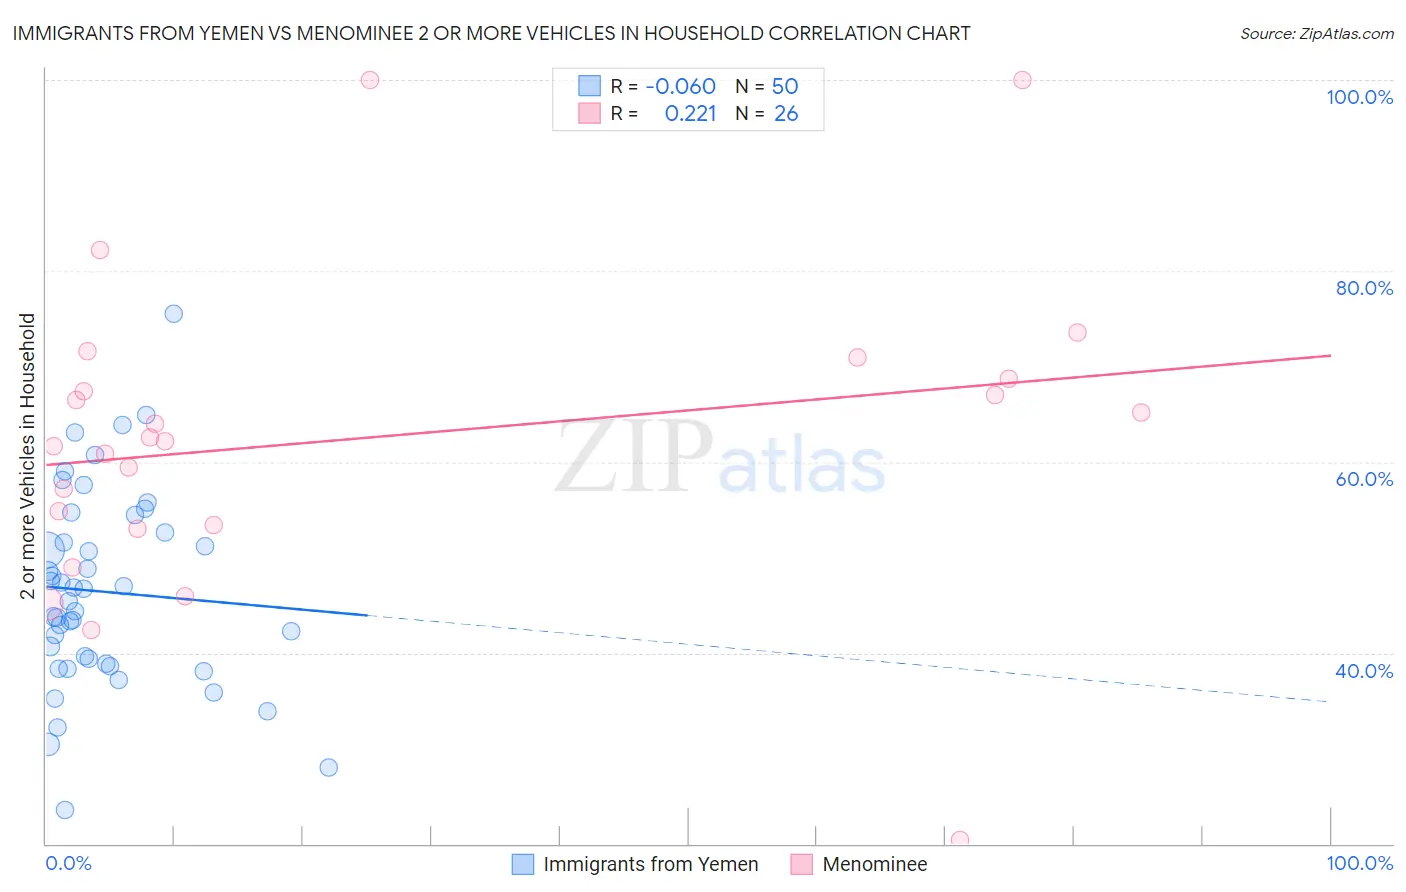
Immigrants from Yemen vs Menominee 2 or more Vehicles in Household Correlation Chart
The statistical analysis conducted on geographies consisting of 82,431,124 people shows a slight negative correlation between the proportion of Immigrants from Yemen and percentage of households with 2 or more vehicles available in the United States with a correlation coefficient (R) of -0.060 and weighted average of 42.8%. Similarly, the statistical analysis conducted on geographies consisting of 45,777,849 people shows a weak positive correlation between the proportion of Menominee and percentage of households with 2 or more vehicles available in the United States with a correlation coefficient (R) of 0.221 and weighted average of 55.3%, a difference of 29.0%.
2 or more Vehicles in Household Correlation Summary
| Measurement | Immigrants from Yemen | Menominee |
| Minimum | 23.5% | 20.4% |
| Maximum | 75.5% | 100.0% |
| Range | 52.0% | 79.6% |
| Mean | 46.4% | 62.5% |
| Median | 46.0% | 62.4% |
| Interquartile 25% (IQ1) | 38.8% | 53.4% |
| Interquartile 75% (IQ3) | 52.6% | 68.7% |
| Interquartile Range (IQR) | 13.8% | 15.3% |
| Standard Deviation (Sample) | 10.3% | 16.5% |
| Standard Deviation (Population) | 10.2% | 16.2% |
Similar Demographics by 2 or more Vehicles in Household
Demographics Similar to Immigrants from Yemen by 2 or more Vehicles in Household
In terms of 2 or more vehicles in household, the demographic groups most similar to Immigrants from Yemen are Immigrants from Senegal (43.0%, a difference of 0.41%), Inupiat (42.6%, a difference of 0.50%), Immigrants from West Indies (43.1%, a difference of 0.56%), Immigrants from Cabo Verde (43.3%, a difference of 1.1%), and Ecuadorian (42.0%, a difference of 2.1%).
| Demographics | Rating | Rank | 2 or more Vehicles in Household |
| Soviet Union | 0.0 /100 | #320 | Tragic 45.7% |
| Immigrants | Jamaica | 0.0 /100 | #321 | Tragic 44.5% |
| Senegalese | 0.0 /100 | #322 | Tragic 44.2% |
| Immigrants | Caribbean | 0.0 /100 | #323 | Tragic 44.2% |
| Immigrants | Cabo Verde | 0.0 /100 | #324 | Tragic 43.3% |
| Immigrants | West Indies | 0.0 /100 | #325 | Tragic 43.1% |
| Immigrants | Senegal | 0.0 /100 | #326 | Tragic 43.0% |
| Immigrants | Yemen | 0.0 /100 | #327 | Tragic 42.8% |
| Inupiat | 0.0 /100 | #328 | Tragic 42.6% |
| Ecuadorians | 0.0 /100 | #329 | Tragic 42.0% |
| Immigrants | Dominica | 0.0 /100 | #330 | Tragic 41.6% |
| West Indians | 0.0 /100 | #331 | Tragic 41.3% |
| Trinidadians and Tobagonians | 0.0 /100 | #332 | Tragic 40.9% |
| Immigrants | Ecuador | 0.0 /100 | #333 | Tragic 40.5% |
| Immigrants | Trinidad and Tobago | 0.0 /100 | #334 | Tragic 40.3% |
Demographics Similar to Menominee by 2 or more Vehicles in Household
In terms of 2 or more vehicles in household, the demographic groups most similar to Menominee are Immigrants from Cuba (55.3%, a difference of 0.030%), Immigrants from Sweden (55.2%, a difference of 0.040%), Immigrants from Denmark (55.3%, a difference of 0.13%), Alaskan Athabascan (55.2%, a difference of 0.13%), and Navajo (55.3%, a difference of 0.15%).
| Demographics | Rating | Rank | 2 or more Vehicles in Household |
| Romanians | 55.8 /100 | #170 | Average 55.5% |
| Immigrants | Costa Rica | 54.4 /100 | #171 | Average 55.4% |
| Immigrants | Nicaragua | 51.6 /100 | #172 | Average 55.4% |
| Immigrants | Western Europe | 51.4 /100 | #173 | Average 55.4% |
| Navajo | 50.0 /100 | #174 | Average 55.3% |
| Immigrants | Denmark | 49.4 /100 | #175 | Average 55.3% |
| Immigrants | Cuba | 47.0 /100 | #176 | Average 55.3% |
| Menominee | 46.2 /100 | #177 | Average 55.3% |
| Immigrants | Sweden | 45.3 /100 | #178 | Average 55.2% |
| Alaskan Athabascans | 42.9 /100 | #179 | Average 55.2% |
| Immigrants | Kenya | 40.4 /100 | #180 | Average 55.1% |
| Immigrants | Micronesia | 38.2 /100 | #181 | Fair 55.1% |
| Cree | 38.2 /100 | #182 | Fair 55.1% |
| Immigrants | Cameroon | 37.3 /100 | #183 | Fair 55.1% |
| Apache | 36.7 /100 | #184 | Fair 55.1% |