Immigrants from Belarus vs Somali 2 or more Vehicles in Household
COMPARE
Immigrants from Belarus
Somali
2 or more Vehicles in Household
2 or more Vehicles in Household Comparison
Immigrants from Belarus
Somalis
47.9%
2 OR MORE VEHICLES IN HOUSEHOLD
0.0/ 100
METRIC RATING
311th/ 347
METRIC RANK
51.1%
2 OR MORE VEHICLES IN HOUSEHOLD
0.0/ 100
METRIC RATING
289th/ 347
METRIC RANK
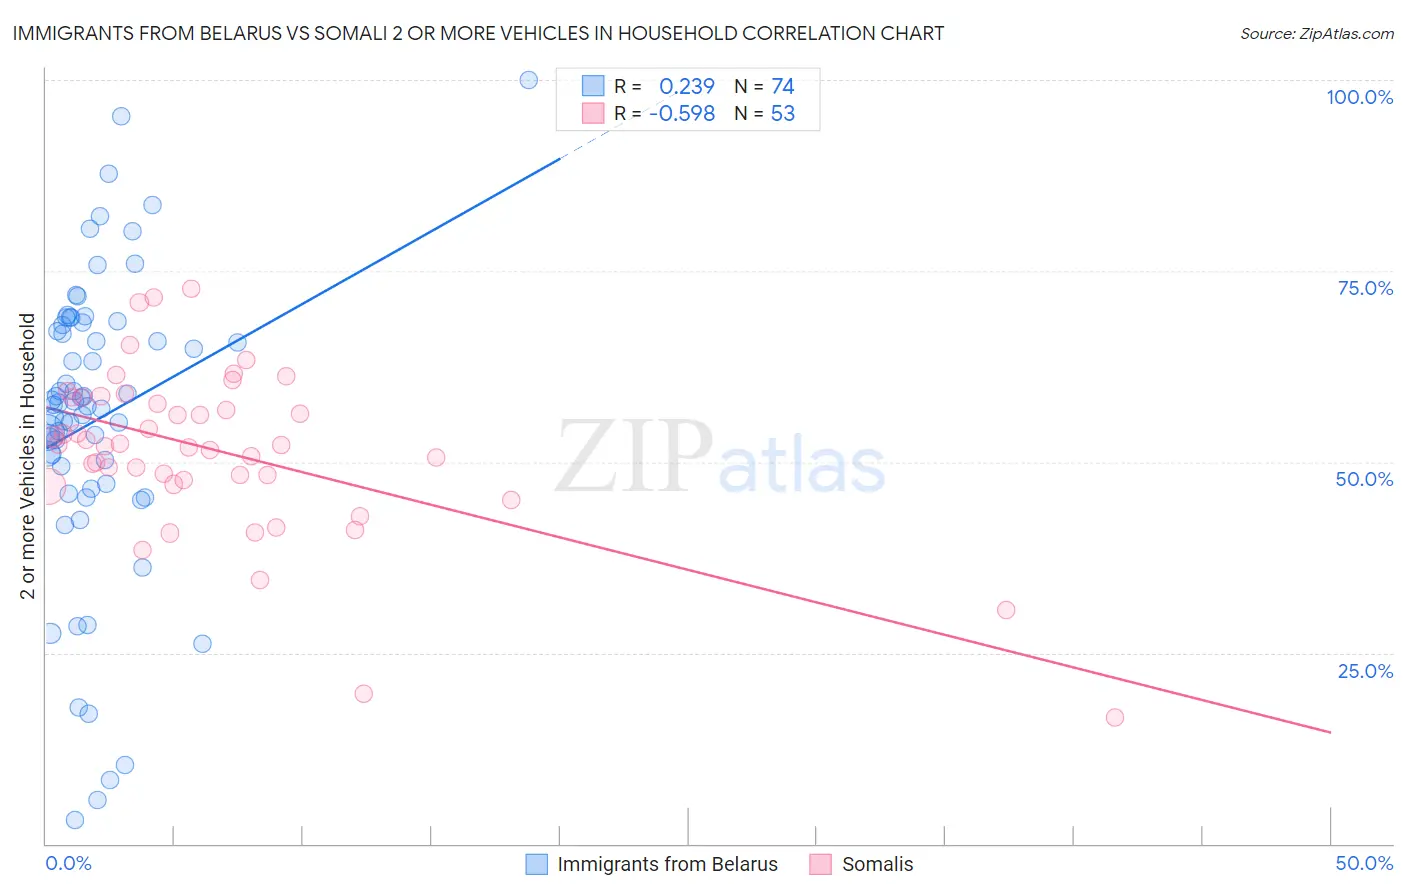
Immigrants from Belarus vs Somali 2 or more Vehicles in Household Correlation Chart
The statistical analysis conducted on geographies consisting of 150,189,140 people shows a weak positive correlation between the proportion of Immigrants from Belarus and percentage of households with 2 or more vehicles available in the United States with a correlation coefficient (R) of 0.239 and weighted average of 47.9%. Similarly, the statistical analysis conducted on geographies consisting of 99,288,956 people shows a substantial negative correlation between the proportion of Somalis and percentage of households with 2 or more vehicles available in the United States with a correlation coefficient (R) of -0.598 and weighted average of 51.1%, a difference of 6.7%.
2 or more Vehicles in Household Correlation Summary
| Measurement | Immigrants from Belarus | Somali |
| Minimum | 3.0% | 16.4% |
| Maximum | 100.0% | 72.6% |
| Range | 97.0% | 56.2% |
| Mean | 55.5% | 51.4% |
| Median | 57.6% | 52.2% |
| Interquartile 25% (IQ1) | 47.1% | 47.3% |
| Interquartile 75% (IQ3) | 67.9% | 58.4% |
| Interquartile Range (IQR) | 20.9% | 11.1% |
| Standard Deviation (Sample) | 19.6% | 10.9% |
| Standard Deviation (Population) | 19.4% | 10.8% |
Similar Demographics by 2 or more Vehicles in Household
Demographics Similar to Immigrants from Belarus by 2 or more Vehicles in Household
In terms of 2 or more vehicles in household, the demographic groups most similar to Immigrants from Belarus are Ghanaian (48.0%, a difference of 0.12%), Haitian (47.6%, a difference of 0.74%), U.S. Virgin Islander (47.5%, a difference of 0.91%), Immigrants from Ghana (47.4%, a difference of 1.1%), and Puerto Rican (47.1%, a difference of 1.7%).
| Demographics | Rating | Rank | 2 or more Vehicles in Household |
| Immigrants | Belize | 0.0 /100 | #304 | Tragic 49.9% |
| Immigrants | Western Africa | 0.0 /100 | #305 | Tragic 49.4% |
| Immigrants | Israel | 0.0 /100 | #306 | Tragic 49.2% |
| Hopi | 0.0 /100 | #307 | Tragic 49.0% |
| Albanians | 0.0 /100 | #308 | Tragic 49.0% |
| Moroccans | 0.0 /100 | #309 | Tragic 48.8% |
| Ghanaians | 0.0 /100 | #310 | Tragic 48.0% |
| Immigrants | Belarus | 0.0 /100 | #311 | Tragic 47.9% |
| Haitians | 0.0 /100 | #312 | Tragic 47.6% |
| U.S. Virgin Islanders | 0.0 /100 | #313 | Tragic 47.5% |
| Immigrants | Ghana | 0.0 /100 | #314 | Tragic 47.4% |
| Puerto Ricans | 0.0 /100 | #315 | Tragic 47.1% |
| Cape Verdeans | 0.0 /100 | #316 | Tragic 46.8% |
| Immigrants | Haiti | 0.0 /100 | #317 | Tragic 46.5% |
| Immigrants | Albania | 0.0 /100 | #318 | Tragic 46.0% |
Demographics Similar to Somalis by 2 or more Vehicles in Household
In terms of 2 or more vehicles in household, the demographic groups most similar to Somalis are Immigrants from Panama (51.1%, a difference of 0.060%), Belizean (51.0%, a difference of 0.10%), Okinawan (51.2%, a difference of 0.28%), Immigrants from Serbia (51.3%, a difference of 0.40%), and Immigrants from Liberia (51.3%, a difference of 0.42%).
| Demographics | Rating | Rank | 2 or more Vehicles in Household |
| Bahamians | 0.1 /100 | #282 | Tragic 51.5% |
| Immigrants | China | 0.1 /100 | #283 | Tragic 51.5% |
| Immigrants | Zaire | 0.1 /100 | #284 | Tragic 51.5% |
| Immigrants | Uruguay | 0.1 /100 | #285 | Tragic 51.4% |
| Immigrants | Liberia | 0.1 /100 | #286 | Tragic 51.3% |
| Immigrants | Serbia | 0.1 /100 | #287 | Tragic 51.3% |
| Okinawans | 0.1 /100 | #288 | Tragic 51.2% |
| Somalis | 0.0 /100 | #289 | Tragic 51.1% |
| Immigrants | Panama | 0.0 /100 | #290 | Tragic 51.1% |
| Belizeans | 0.0 /100 | #291 | Tragic 51.0% |
| Immigrants | Ukraine | 0.0 /100 | #292 | Tragic 50.9% |
| Blacks/African Americans | 0.0 /100 | #293 | Tragic 50.9% |
| Bermudans | 0.0 /100 | #294 | Tragic 50.6% |
| Cypriots | 0.0 /100 | #295 | Tragic 50.6% |
| Immigrants | Somalia | 0.0 /100 | #296 | Tragic 50.5% |