Immigrants from Belarus vs Fijian 2 or more Vehicles in Household
COMPARE
Immigrants from Belarus
Fijian
2 or more Vehicles in Household
2 or more Vehicles in Household Comparison
Immigrants from Belarus
Fijians
47.9%
2 OR MORE VEHICLES IN HOUSEHOLD
0.0/ 100
METRIC RATING
311th/ 347
METRIC RANK
57.6%
2 OR MORE VEHICLES IN HOUSEHOLD
98.4/ 100
METRIC RATING
100th/ 347
METRIC RANK
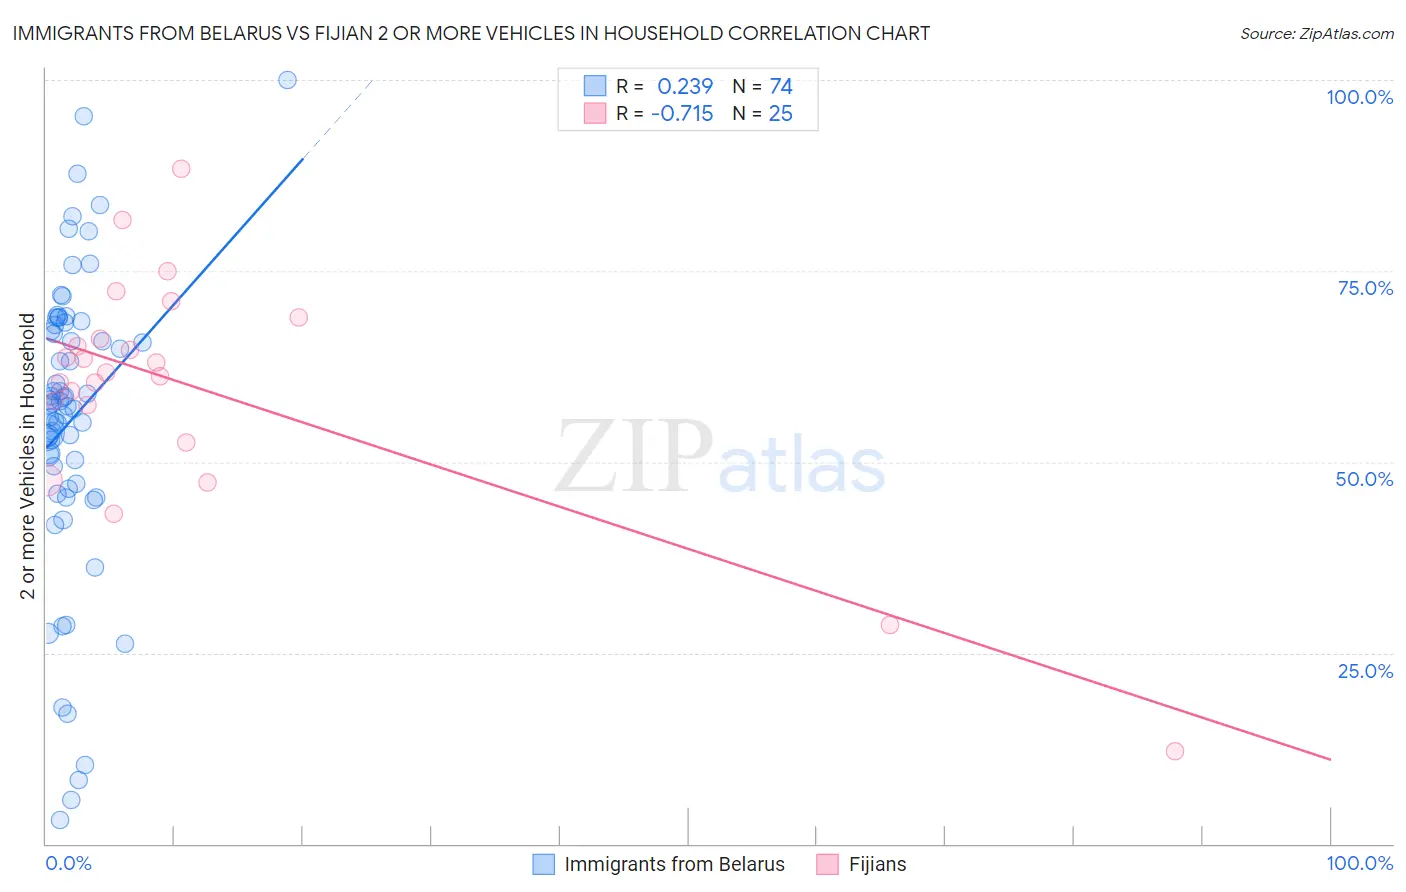
Immigrants from Belarus vs Fijian 2 or more Vehicles in Household Correlation Chart
The statistical analysis conducted on geographies consisting of 150,189,140 people shows a weak positive correlation between the proportion of Immigrants from Belarus and percentage of households with 2 or more vehicles available in the United States with a correlation coefficient (R) of 0.239 and weighted average of 47.9%. Similarly, the statistical analysis conducted on geographies consisting of 55,948,040 people shows a strong negative correlation between the proportion of Fijians and percentage of households with 2 or more vehicles available in the United States with a correlation coefficient (R) of -0.715 and weighted average of 57.6%, a difference of 20.3%.
2 or more Vehicles in Household Correlation Summary
| Measurement | Immigrants from Belarus | Fijian |
| Minimum | 3.0% | 12.2% |
| Maximum | 100.0% | 88.4% |
| Range | 97.0% | 76.3% |
| Mean | 55.5% | 59.7% |
| Median | 57.6% | 61.6% |
| Interquartile 25% (IQ1) | 47.1% | 54.9% |
| Interquartile 75% (IQ3) | 67.9% | 67.6% |
| Interquartile Range (IQR) | 20.9% | 12.6% |
| Standard Deviation (Sample) | 19.6% | 15.7% |
| Standard Deviation (Population) | 19.4% | 15.4% |
Similar Demographics by 2 or more Vehicles in Household
Demographics Similar to Immigrants from Belarus by 2 or more Vehicles in Household
In terms of 2 or more vehicles in household, the demographic groups most similar to Immigrants from Belarus are Ghanaian (48.0%, a difference of 0.12%), Haitian (47.6%, a difference of 0.74%), U.S. Virgin Islander (47.5%, a difference of 0.91%), Immigrants from Ghana (47.4%, a difference of 1.1%), and Puerto Rican (47.1%, a difference of 1.7%).
| Demographics | Rating | Rank | 2 or more Vehicles in Household |
| Immigrants | Belize | 0.0 /100 | #304 | Tragic 49.9% |
| Immigrants | Western Africa | 0.0 /100 | #305 | Tragic 49.4% |
| Immigrants | Israel | 0.0 /100 | #306 | Tragic 49.2% |
| Hopi | 0.0 /100 | #307 | Tragic 49.0% |
| Albanians | 0.0 /100 | #308 | Tragic 49.0% |
| Moroccans | 0.0 /100 | #309 | Tragic 48.8% |
| Ghanaians | 0.0 /100 | #310 | Tragic 48.0% |
| Immigrants | Belarus | 0.0 /100 | #311 | Tragic 47.9% |
| Haitians | 0.0 /100 | #312 | Tragic 47.6% |
| U.S. Virgin Islanders | 0.0 /100 | #313 | Tragic 47.5% |
| Immigrants | Ghana | 0.0 /100 | #314 | Tragic 47.4% |
| Puerto Ricans | 0.0 /100 | #315 | Tragic 47.1% |
| Cape Verdeans | 0.0 /100 | #316 | Tragic 46.8% |
| Immigrants | Haiti | 0.0 /100 | #317 | Tragic 46.5% |
| Immigrants | Albania | 0.0 /100 | #318 | Tragic 46.0% |
Demographics Similar to Fijians by 2 or more Vehicles in Household
In terms of 2 or more vehicles in household, the demographic groups most similar to Fijians are Lebanese (57.6%, a difference of 0.050%), Cajun (57.7%, a difference of 0.070%), Immigrants from Bolivia (57.6%, a difference of 0.090%), Jordanian (57.6%, a difference of 0.10%), and Immigrants from Indonesia (57.6%, a difference of 0.10%).
| Demographics | Rating | Rank | 2 or more Vehicles in Household |
| Ottawa | 99.0 /100 | #93 | Exceptional 57.9% |
| Filipinos | 98.9 /100 | #94 | Exceptional 57.8% |
| Hmong | 98.9 /100 | #95 | Exceptional 57.8% |
| Burmese | 98.8 /100 | #96 | Exceptional 57.8% |
| Slavs | 98.8 /100 | #97 | Exceptional 57.8% |
| Palestinians | 98.6 /100 | #98 | Exceptional 57.7% |
| Cajuns | 98.5 /100 | #99 | Exceptional 57.7% |
| Fijians | 98.4 /100 | #100 | Exceptional 57.6% |
| Lebanese | 98.3 /100 | #101 | Exceptional 57.6% |
| Immigrants | Bolivia | 98.2 /100 | #102 | Exceptional 57.6% |
| Jordanians | 98.2 /100 | #103 | Exceptional 57.6% |
| Immigrants | Indonesia | 98.2 /100 | #104 | Exceptional 57.6% |
| Immigrants | Korea | 98.2 /100 | #105 | Exceptional 57.6% |
| Immigrants | Oceania | 98.2 /100 | #106 | Exceptional 57.5% |
| Immigrants | Netherlands | 98.2 /100 | #107 | Exceptional 57.5% |