Immigrants from Belarus vs Somali 10th Grade
COMPARE
Immigrants from Belarus
Somali
10th Grade
10th Grade Comparison
Immigrants from Belarus
Somalis
94.4%
10TH GRADE
95.2/ 100
METRIC RATING
121st/ 347
METRIC RANK
93.2%
10TH GRADE
6.2/ 100
METRIC RATING
225th/ 347
METRIC RANK
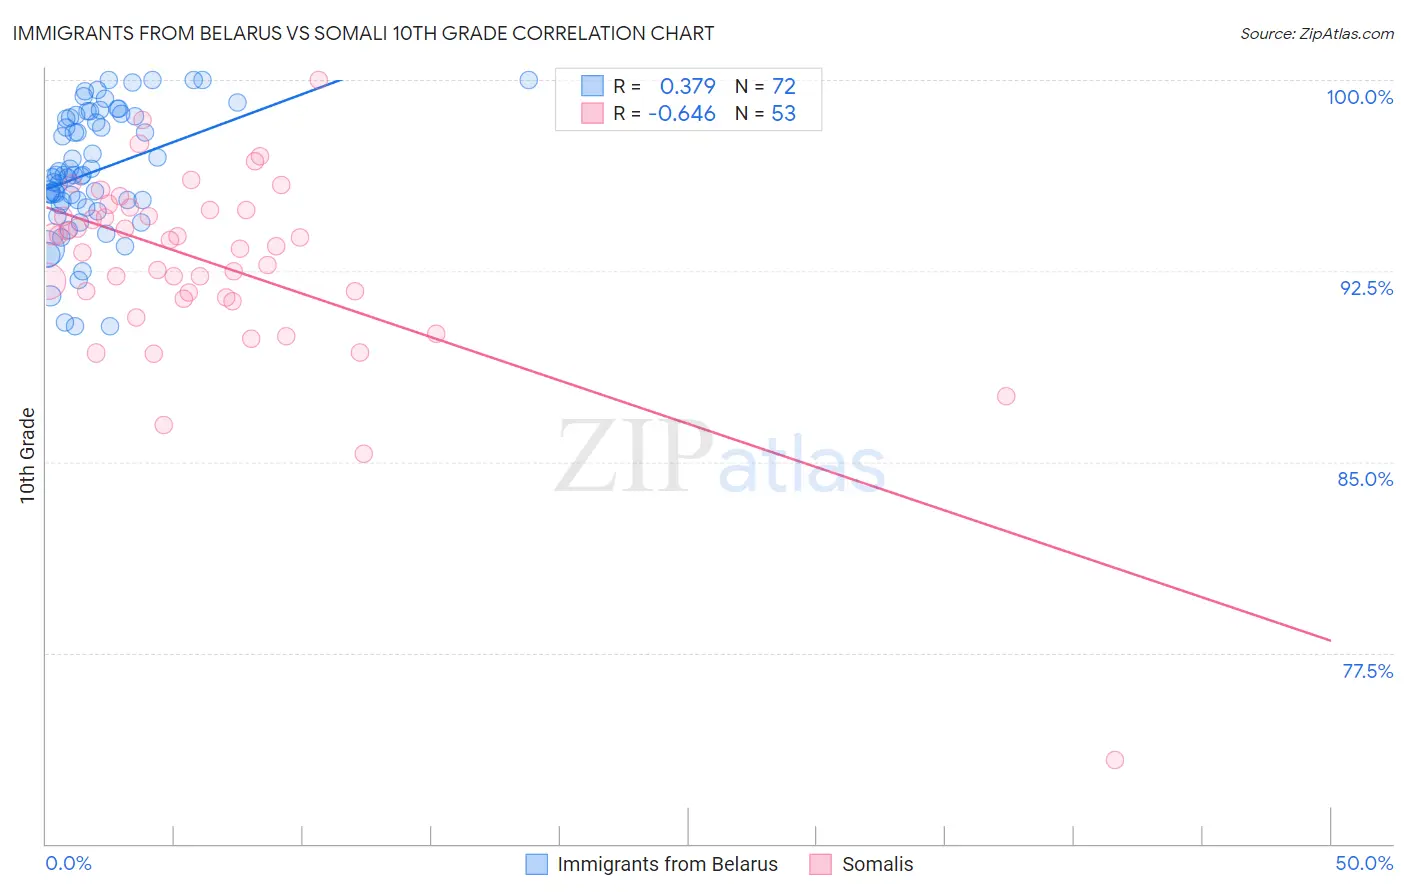
Immigrants from Belarus vs Somali 10th Grade Correlation Chart
The statistical analysis conducted on geographies consisting of 149,993,317 people shows a mild positive correlation between the proportion of Immigrants from Belarus and percentage of population with at least 10th grade education in the United States with a correlation coefficient (R) of 0.379 and weighted average of 94.4%. Similarly, the statistical analysis conducted on geographies consisting of 99,330,527 people shows a significant negative correlation between the proportion of Somalis and percentage of population with at least 10th grade education in the United States with a correlation coefficient (R) of -0.646 and weighted average of 93.2%, a difference of 1.3%.
10th Grade Correlation Summary
| Measurement | Immigrants from Belarus | Somali |
| Minimum | 90.3% | 73.3% |
| Maximum | 100.0% | 100.0% |
| Range | 9.7% | 26.7% |
| Mean | 96.4% | 92.8% |
| Median | 96.3% | 93.5% |
| Interquartile 25% (IQ1) | 95.2% | 91.4% |
| Interquartile 75% (IQ3) | 98.6% | 94.9% |
| Interquartile Range (IQR) | 3.4% | 3.5% |
| Standard Deviation (Sample) | 2.5% | 3.9% |
| Standard Deviation (Population) | 2.5% | 3.9% |
Similar Demographics by 10th Grade
Demographics Similar to Immigrants from Belarus by 10th Grade
In terms of 10th grade, the demographic groups most similar to Immigrants from Belarus are Inupiat (94.4%, a difference of 0.0%), Cree (94.4%, a difference of 0.0%), Immigrants from Israel (94.4%, a difference of 0.010%), Immigrants from Taiwan (94.4%, a difference of 0.010%), and Basque (94.3%, a difference of 0.010%).
| Demographics | Rating | Rank | 10th Grade |
| German Russians | 96.3 /100 | #114 | Exceptional 94.4% |
| Delaware | 96.3 /100 | #115 | Exceptional 94.4% |
| Sioux | 96.2 /100 | #116 | Exceptional 94.4% |
| Immigrants | Hungary | 95.8 /100 | #117 | Exceptional 94.4% |
| Jordanians | 95.6 /100 | #118 | Exceptional 94.4% |
| Immigrants | Israel | 95.4 /100 | #119 | Exceptional 94.4% |
| Immigrants | Taiwan | 95.3 /100 | #120 | Exceptional 94.4% |
| Immigrants | Belarus | 95.2 /100 | #121 | Exceptional 94.4% |
| Inupiat | 95.1 /100 | #122 | Exceptional 94.4% |
| Cree | 95.1 /100 | #123 | Exceptional 94.4% |
| Basques | 94.9 /100 | #124 | Exceptional 94.3% |
| Americans | 94.4 /100 | #125 | Exceptional 94.3% |
| Immigrants | Iran | 94.4 /100 | #126 | Exceptional 94.3% |
| Israelis | 93.8 /100 | #127 | Exceptional 94.3% |
| Potawatomi | 93.6 /100 | #128 | Exceptional 94.3% |
Demographics Similar to Somalis by 10th Grade
In terms of 10th grade, the demographic groups most similar to Somalis are Korean (93.2%, a difference of 0.0%), Black/African American (93.2%, a difference of 0.0%), Immigrants from China (93.2%, a difference of 0.010%), Bolivian (93.2%, a difference of 0.020%), and Immigrants from Ethiopia (93.1%, a difference of 0.040%).
| Demographics | Rating | Rank | 10th Grade |
| Immigrants | Liberia | 10.2 /100 | #218 | Poor 93.3% |
| Seminole | 10.2 /100 | #219 | Poor 93.3% |
| Tongans | 9.5 /100 | #220 | Tragic 93.3% |
| Immigrants | Southern Europe | 8.9 /100 | #221 | Tragic 93.2% |
| Ethiopians | 7.9 /100 | #222 | Tragic 93.2% |
| Immigrants | Sierra Leone | 7.6 /100 | #223 | Tragic 93.2% |
| Bolivians | 6.7 /100 | #224 | Tragic 93.2% |
| Somalis | 6.2 /100 | #225 | Tragic 93.2% |
| Koreans | 6.1 /100 | #226 | Tragic 93.2% |
| Blacks/African Americans | 6.0 /100 | #227 | Tragic 93.2% |
| Immigrants | China | 5.9 /100 | #228 | Tragic 93.2% |
| Immigrants | Ethiopia | 5.1 /100 | #229 | Tragic 93.1% |
| Immigrants | Africa | 5.0 /100 | #230 | Tragic 93.1% |
| South American Indians | 4.9 /100 | #231 | Tragic 93.1% |
| Bahamians | 4.9 /100 | #232 | Tragic 93.1% |