Ecuadorian vs Somali 2 or more Vehicles in Household
COMPARE
Ecuadorian
Somali
2 or more Vehicles in Household
2 or more Vehicles in Household Comparison
Ecuadorians
Somalis
42.0%
2 OR MORE VEHICLES IN HOUSEHOLD
0.0/ 100
METRIC RATING
329th/ 347
METRIC RANK
51.1%
2 OR MORE VEHICLES IN HOUSEHOLD
0.0/ 100
METRIC RATING
289th/ 347
METRIC RANK
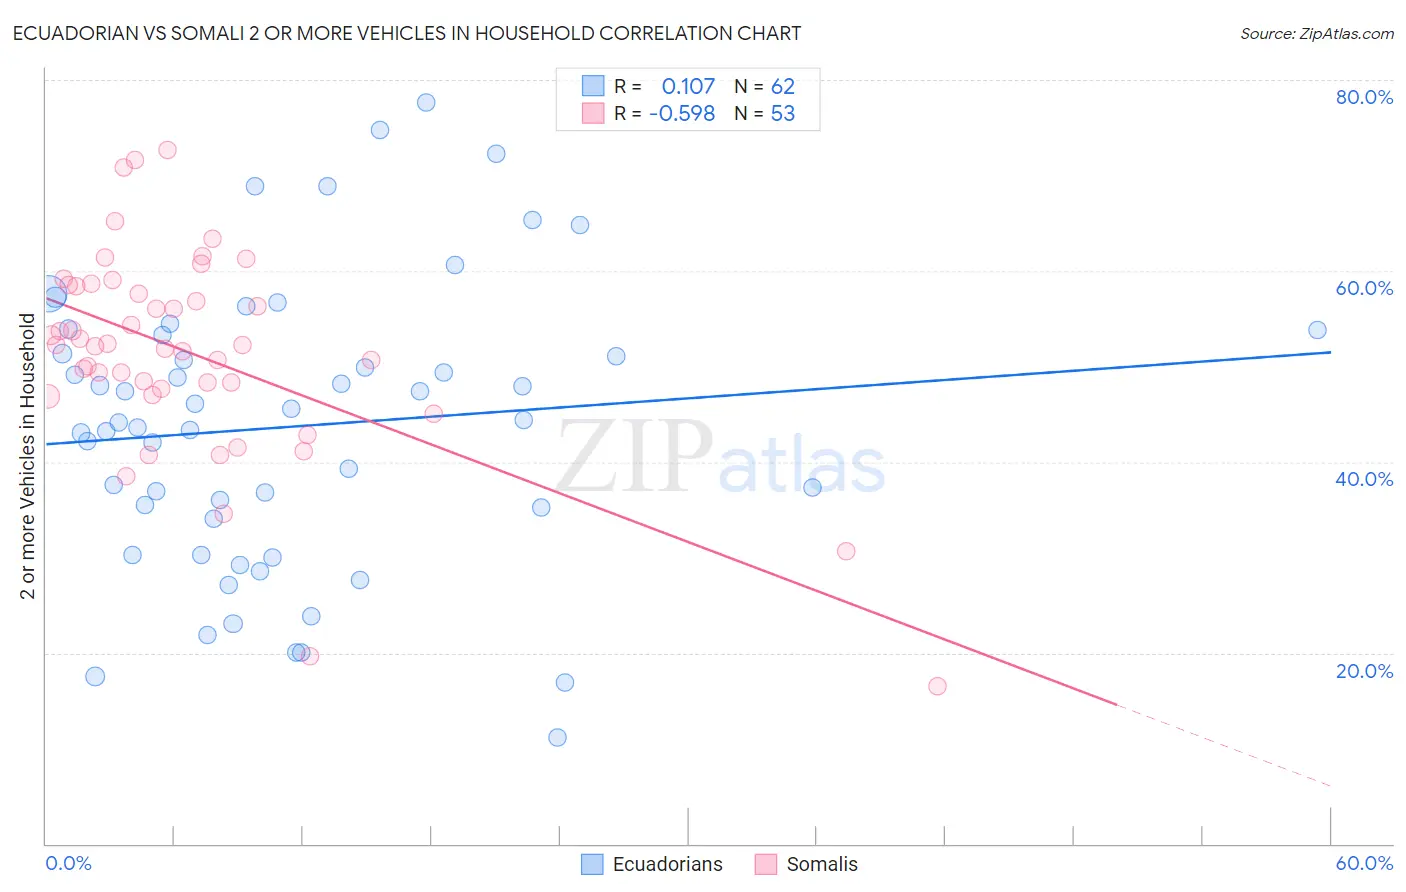
Ecuadorian vs Somali 2 or more Vehicles in Household Correlation Chart
The statistical analysis conducted on geographies consisting of 317,664,097 people shows a poor positive correlation between the proportion of Ecuadorians and percentage of households with 2 or more vehicles available in the United States with a correlation coefficient (R) of 0.107 and weighted average of 42.0%. Similarly, the statistical analysis conducted on geographies consisting of 99,288,956 people shows a substantial negative correlation between the proportion of Somalis and percentage of households with 2 or more vehicles available in the United States with a correlation coefficient (R) of -0.598 and weighted average of 51.1%, a difference of 21.7%.
2 or more Vehicles in Household Correlation Summary
| Measurement | Ecuadorian | Somali |
| Minimum | 11.1% | 16.4% |
| Maximum | 77.6% | 72.6% |
| Range | 66.5% | 56.2% |
| Mean | 43.7% | 51.4% |
| Median | 44.3% | 52.2% |
| Interquartile 25% (IQ1) | 34.1% | 47.3% |
| Interquartile 75% (IQ3) | 53.3% | 58.4% |
| Interquartile Range (IQR) | 19.3% | 11.1% |
| Standard Deviation (Sample) | 15.0% | 10.9% |
| Standard Deviation (Population) | 14.9% | 10.8% |
Similar Demographics by 2 or more Vehicles in Household
Demographics Similar to Ecuadorians by 2 or more Vehicles in Household
In terms of 2 or more vehicles in household, the demographic groups most similar to Ecuadorians are Immigrants from Dominica (41.6%, a difference of 0.82%), Inupiat (42.6%, a difference of 1.6%), West Indian (41.3%, a difference of 1.7%), Immigrants from Yemen (42.8%, a difference of 2.1%), and Immigrants from Senegal (43.0%, a difference of 2.5%).
| Demographics | Rating | Rank | 2 or more Vehicles in Household |
| Senegalese | 0.0 /100 | #322 | Tragic 44.2% |
| Immigrants | Caribbean | 0.0 /100 | #323 | Tragic 44.2% |
| Immigrants | Cabo Verde | 0.0 /100 | #324 | Tragic 43.3% |
| Immigrants | West Indies | 0.0 /100 | #325 | Tragic 43.1% |
| Immigrants | Senegal | 0.0 /100 | #326 | Tragic 43.0% |
| Immigrants | Yemen | 0.0 /100 | #327 | Tragic 42.8% |
| Inupiat | 0.0 /100 | #328 | Tragic 42.6% |
| Ecuadorians | 0.0 /100 | #329 | Tragic 42.0% |
| Immigrants | Dominica | 0.0 /100 | #330 | Tragic 41.6% |
| West Indians | 0.0 /100 | #331 | Tragic 41.3% |
| Trinidadians and Tobagonians | 0.0 /100 | #332 | Tragic 40.9% |
| Immigrants | Ecuador | 0.0 /100 | #333 | Tragic 40.5% |
| Immigrants | Trinidad and Tobago | 0.0 /100 | #334 | Tragic 40.3% |
| Immigrants | Bangladesh | 0.0 /100 | #335 | Tragic 38.8% |
| Vietnamese | 0.0 /100 | #336 | Tragic 38.5% |
Demographics Similar to Somalis by 2 or more Vehicles in Household
In terms of 2 or more vehicles in household, the demographic groups most similar to Somalis are Immigrants from Panama (51.1%, a difference of 0.060%), Belizean (51.0%, a difference of 0.10%), Okinawan (51.2%, a difference of 0.28%), Immigrants from Serbia (51.3%, a difference of 0.40%), and Immigrants from Liberia (51.3%, a difference of 0.42%).
| Demographics | Rating | Rank | 2 or more Vehicles in Household |
| Bahamians | 0.1 /100 | #282 | Tragic 51.5% |
| Immigrants | China | 0.1 /100 | #283 | Tragic 51.5% |
| Immigrants | Zaire | 0.1 /100 | #284 | Tragic 51.5% |
| Immigrants | Uruguay | 0.1 /100 | #285 | Tragic 51.4% |
| Immigrants | Liberia | 0.1 /100 | #286 | Tragic 51.3% |
| Immigrants | Serbia | 0.1 /100 | #287 | Tragic 51.3% |
| Okinawans | 0.1 /100 | #288 | Tragic 51.2% |
| Somalis | 0.0 /100 | #289 | Tragic 51.1% |
| Immigrants | Panama | 0.0 /100 | #290 | Tragic 51.1% |
| Belizeans | 0.0 /100 | #291 | Tragic 51.0% |
| Immigrants | Ukraine | 0.0 /100 | #292 | Tragic 50.9% |
| Blacks/African Americans | 0.0 /100 | #293 | Tragic 50.9% |
| Bermudans | 0.0 /100 | #294 | Tragic 50.6% |
| Cypriots | 0.0 /100 | #295 | Tragic 50.6% |
| Immigrants | Somalia | 0.0 /100 | #296 | Tragic 50.5% |