Immigrants from Belarus vs Immigrants from South Eastern Asia 2 or more Vehicles in Household
COMPARE
Immigrants from Belarus
Immigrants from South Eastern Asia
2 or more Vehicles in Household
2 or more Vehicles in Household Comparison
Immigrants from Belarus
Immigrants from South Eastern Asia
47.9%
2 OR MORE VEHICLES IN HOUSEHOLD
0.0/ 100
METRIC RATING
311th/ 347
METRIC RANK
59.6%
2 OR MORE VEHICLES IN HOUSEHOLD
100.0/ 100
METRIC RATING
46th/ 347
METRIC RANK
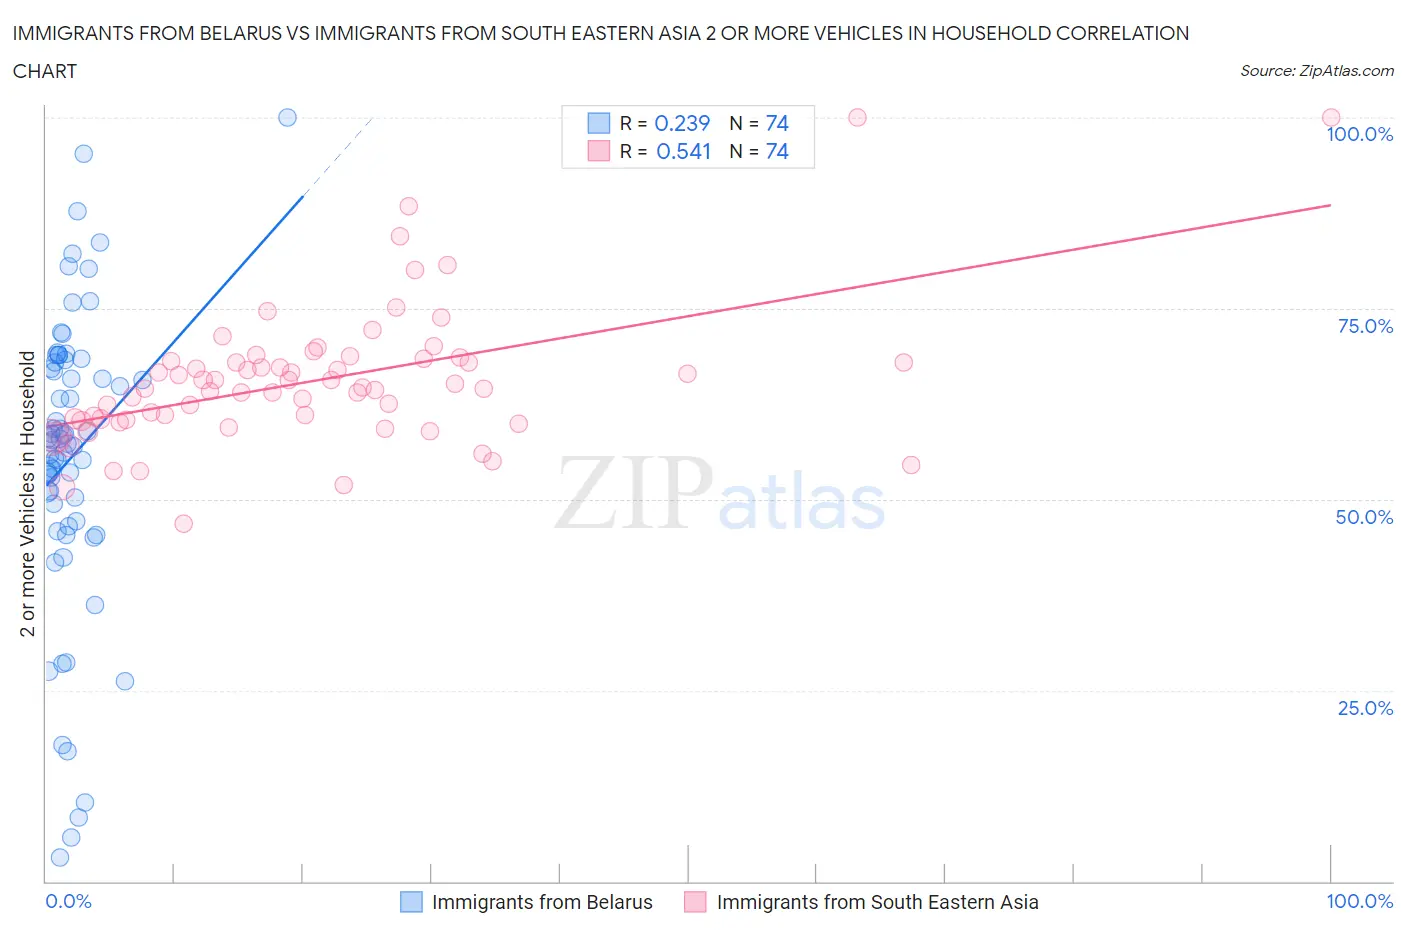
Immigrants from Belarus vs Immigrants from South Eastern Asia 2 or more Vehicles in Household Correlation Chart
The statistical analysis conducted on geographies consisting of 150,189,140 people shows a weak positive correlation between the proportion of Immigrants from Belarus and percentage of households with 2 or more vehicles available in the United States with a correlation coefficient (R) of 0.239 and weighted average of 47.9%. Similarly, the statistical analysis conducted on geographies consisting of 512,289,317 people shows a substantial positive correlation between the proportion of Immigrants from South Eastern Asia and percentage of households with 2 or more vehicles available in the United States with a correlation coefficient (R) of 0.541 and weighted average of 59.6%, a difference of 24.4%.
2 or more Vehicles in Household Correlation Summary
| Measurement | Immigrants from Belarus | Immigrants from South Eastern Asia |
| Minimum | 3.0% | 46.9% |
| Maximum | 100.0% | 100.0% |
| Range | 97.0% | 53.1% |
| Mean | 55.5% | 65.6% |
| Median | 57.6% | 64.5% |
| Interquartile 25% (IQ1) | 47.1% | 60.4% |
| Interquartile 75% (IQ3) | 67.9% | 68.0% |
| Interquartile Range (IQR) | 20.9% | 7.6% |
| Standard Deviation (Sample) | 19.6% | 9.2% |
| Standard Deviation (Population) | 19.4% | 9.1% |
Similar Demographics by 2 or more Vehicles in Household
Demographics Similar to Immigrants from Belarus by 2 or more Vehicles in Household
In terms of 2 or more vehicles in household, the demographic groups most similar to Immigrants from Belarus are Ghanaian (48.0%, a difference of 0.12%), Haitian (47.6%, a difference of 0.74%), U.S. Virgin Islander (47.5%, a difference of 0.91%), Immigrants from Ghana (47.4%, a difference of 1.1%), and Puerto Rican (47.1%, a difference of 1.7%).
| Demographics | Rating | Rank | 2 or more Vehicles in Household |
| Immigrants | Belize | 0.0 /100 | #304 | Tragic 49.9% |
| Immigrants | Western Africa | 0.0 /100 | #305 | Tragic 49.4% |
| Immigrants | Israel | 0.0 /100 | #306 | Tragic 49.2% |
| Hopi | 0.0 /100 | #307 | Tragic 49.0% |
| Albanians | 0.0 /100 | #308 | Tragic 49.0% |
| Moroccans | 0.0 /100 | #309 | Tragic 48.8% |
| Ghanaians | 0.0 /100 | #310 | Tragic 48.0% |
| Immigrants | Belarus | 0.0 /100 | #311 | Tragic 47.9% |
| Haitians | 0.0 /100 | #312 | Tragic 47.6% |
| U.S. Virgin Islanders | 0.0 /100 | #313 | Tragic 47.5% |
| Immigrants | Ghana | 0.0 /100 | #314 | Tragic 47.4% |
| Puerto Ricans | 0.0 /100 | #315 | Tragic 47.1% |
| Cape Verdeans | 0.0 /100 | #316 | Tragic 46.8% |
| Immigrants | Haiti | 0.0 /100 | #317 | Tragic 46.5% |
| Immigrants | Albania | 0.0 /100 | #318 | Tragic 46.0% |
Demographics Similar to Immigrants from South Eastern Asia by 2 or more Vehicles in Household
In terms of 2 or more vehicles in household, the demographic groups most similar to Immigrants from South Eastern Asia are Immigrants from Taiwan (59.7%, a difference of 0.25%), French (59.8%, a difference of 0.29%), Czechoslovakian (59.8%, a difference of 0.35%), Malaysian (59.8%, a difference of 0.43%), and Northern European (59.9%, a difference of 0.44%).
| Demographics | Rating | Rank | 2 or more Vehicles in Household |
| British | 100.0 /100 | #39 | Exceptional 60.0% |
| Cherokee | 100.0 /100 | #40 | Exceptional 59.9% |
| Northern Europeans | 100.0 /100 | #41 | Exceptional 59.9% |
| Malaysians | 100.0 /100 | #42 | Exceptional 59.8% |
| Czechoslovakians | 100.0 /100 | #43 | Exceptional 59.8% |
| French | 100.0 /100 | #44 | Exceptional 59.8% |
| Immigrants | Taiwan | 100.0 /100 | #45 | Exceptional 59.7% |
| Immigrants | South Eastern Asia | 100.0 /100 | #46 | Exceptional 59.6% |
| Yaqui | 99.9 /100 | #47 | Exceptional 59.3% |
| Immigrants | India | 99.9 /100 | #48 | Exceptional 59.3% |
| Belgians | 99.9 /100 | #49 | Exceptional 59.3% |
| Choctaw | 99.9 /100 | #50 | Exceptional 59.3% |
| Spaniards | 99.9 /100 | #51 | Exceptional 59.2% |
| Immigrants | Laos | 99.9 /100 | #52 | Exceptional 59.2% |
| Celtics | 99.9 /100 | #53 | Exceptional 59.2% |