Portuguese vs Somali 2 or more Vehicles in Household
COMPARE
Portuguese
Somali
2 or more Vehicles in Household
2 or more Vehicles in Household Comparison
Portuguese
Somalis
58.6%
2 OR MORE VEHICLES IN HOUSEHOLD
99.7/ 100
METRIC RATING
64th/ 347
METRIC RANK
51.1%
2 OR MORE VEHICLES IN HOUSEHOLD
0.0/ 100
METRIC RATING
289th/ 347
METRIC RANK
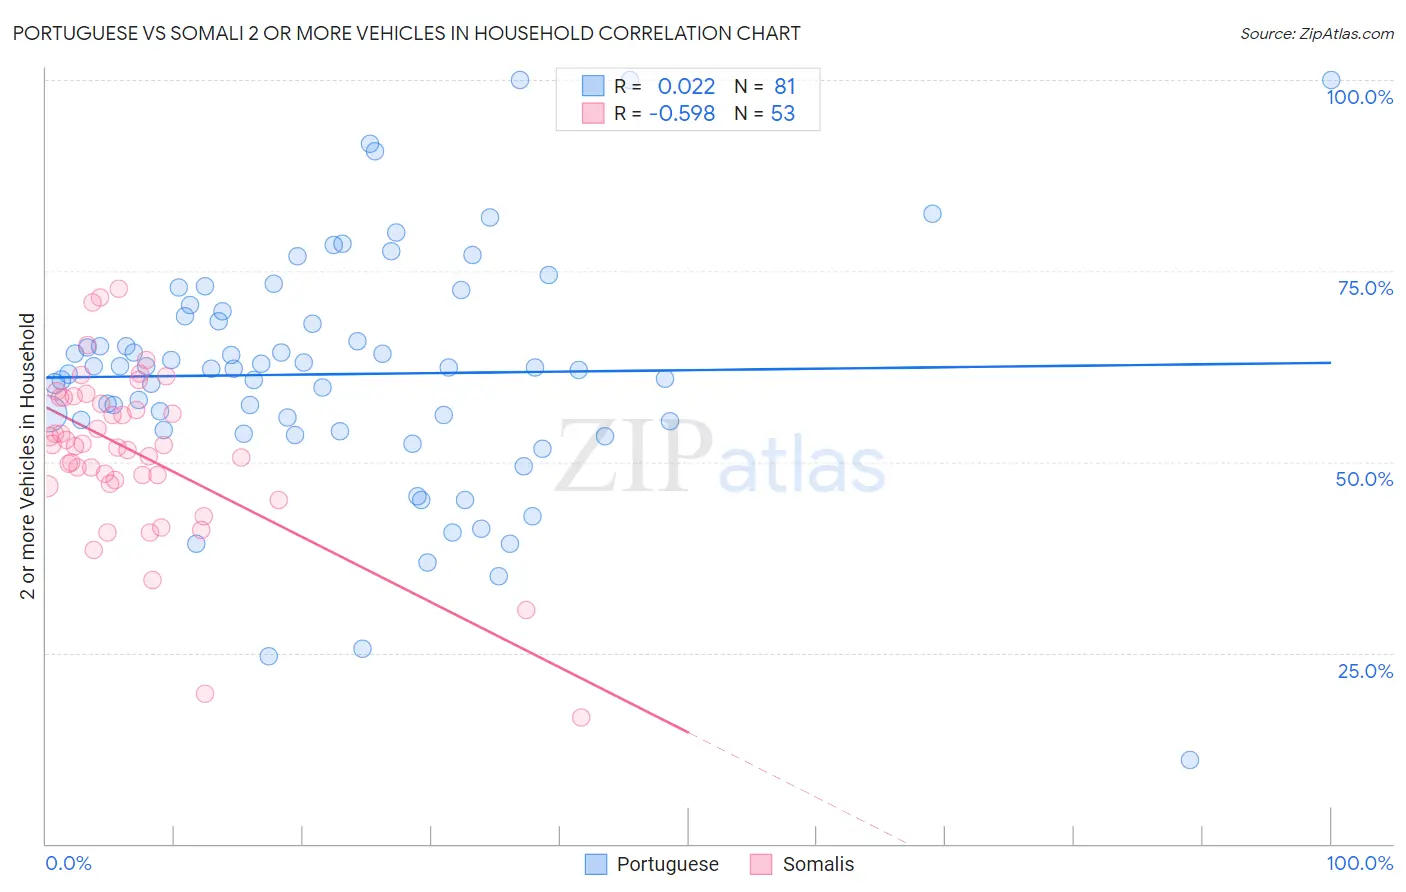
Portuguese vs Somali 2 or more Vehicles in Household Correlation Chart
The statistical analysis conducted on geographies consisting of 450,032,677 people shows no correlation between the proportion of Portuguese and percentage of households with 2 or more vehicles available in the United States with a correlation coefficient (R) of 0.022 and weighted average of 58.6%. Similarly, the statistical analysis conducted on geographies consisting of 99,288,956 people shows a substantial negative correlation between the proportion of Somalis and percentage of households with 2 or more vehicles available in the United States with a correlation coefficient (R) of -0.598 and weighted average of 51.1%, a difference of 14.7%.
2 or more Vehicles in Household Correlation Summary
| Measurement | Portuguese | Somali |
| Minimum | 11.0% | 16.4% |
| Maximum | 100.0% | 72.6% |
| Range | 89.0% | 56.2% |
| Mean | 61.5% | 51.4% |
| Median | 62.2% | 52.2% |
| Interquartile 25% (IQ1) | 54.1% | 47.3% |
| Interquartile 75% (IQ3) | 69.4% | 58.4% |
| Interquartile Range (IQR) | 15.3% | 11.1% |
| Standard Deviation (Sample) | 15.9% | 10.9% |
| Standard Deviation (Population) | 15.8% | 10.8% |
Similar Demographics by 2 or more Vehicles in Household
Demographics Similar to Portuguese by 2 or more Vehicles in Household
In terms of 2 or more vehicles in household, the demographic groups most similar to Portuguese are Immigrants from Central America (58.6%, a difference of 0.050%), Croatian (58.6%, a difference of 0.060%), Laotian (58.6%, a difference of 0.070%), Canadian (58.6%, a difference of 0.090%), and Mexican American Indian (58.7%, a difference of 0.16%).
| Demographics | Rating | Rank | 2 or more Vehicles in Household |
| Afghans | 99.9 /100 | #57 | Exceptional 59.0% |
| Immigrants | Scotland | 99.8 /100 | #58 | Exceptional 58.9% |
| Spanish Americans | 99.8 /100 | #59 | Exceptional 58.9% |
| French Canadians | 99.8 /100 | #60 | Exceptional 58.9% |
| Osage | 99.8 /100 | #61 | Exceptional 58.8% |
| Immigrants | Nonimmigrants | 99.8 /100 | #62 | Exceptional 58.8% |
| Mexican American Indians | 99.8 /100 | #63 | Exceptional 58.7% |
| Portuguese | 99.7 /100 | #64 | Exceptional 58.6% |
| Immigrants | Central America | 99.7 /100 | #65 | Exceptional 58.6% |
| Croatians | 99.7 /100 | #66 | Exceptional 58.6% |
| Laotians | 99.7 /100 | #67 | Exceptional 58.6% |
| Canadians | 99.7 /100 | #68 | Exceptional 58.6% |
| Pennsylvania Germans | 99.7 /100 | #69 | Exceptional 58.5% |
| Italians | 99.6 /100 | #70 | Exceptional 58.4% |
| Bangladeshis | 99.6 /100 | #71 | Exceptional 58.4% |
Demographics Similar to Somalis by 2 or more Vehicles in Household
In terms of 2 or more vehicles in household, the demographic groups most similar to Somalis are Immigrants from Panama (51.1%, a difference of 0.060%), Belizean (51.0%, a difference of 0.10%), Okinawan (51.2%, a difference of 0.28%), Immigrants from Serbia (51.3%, a difference of 0.40%), and Immigrants from Liberia (51.3%, a difference of 0.42%).
| Demographics | Rating | Rank | 2 or more Vehicles in Household |
| Bahamians | 0.1 /100 | #282 | Tragic 51.5% |
| Immigrants | China | 0.1 /100 | #283 | Tragic 51.5% |
| Immigrants | Zaire | 0.1 /100 | #284 | Tragic 51.5% |
| Immigrants | Uruguay | 0.1 /100 | #285 | Tragic 51.4% |
| Immigrants | Liberia | 0.1 /100 | #286 | Tragic 51.3% |
| Immigrants | Serbia | 0.1 /100 | #287 | Tragic 51.3% |
| Okinawans | 0.1 /100 | #288 | Tragic 51.2% |
| Somalis | 0.0 /100 | #289 | Tragic 51.1% |
| Immigrants | Panama | 0.0 /100 | #290 | Tragic 51.1% |
| Belizeans | 0.0 /100 | #291 | Tragic 51.0% |
| Immigrants | Ukraine | 0.0 /100 | #292 | Tragic 50.9% |
| Blacks/African Americans | 0.0 /100 | #293 | Tragic 50.9% |
| Bermudans | 0.0 /100 | #294 | Tragic 50.6% |
| Cypriots | 0.0 /100 | #295 | Tragic 50.6% |
| Immigrants | Somalia | 0.0 /100 | #296 | Tragic 50.5% |