Immigrants from Belarus vs Somali 4th Grade
COMPARE
Immigrants from Belarus
Somali
4th Grade
4th Grade Comparison
Immigrants from Belarus
Somalis
97.5%
4TH GRADE
55.8/ 100
METRIC RATING
168th/ 347
METRIC RANK
96.6%
4TH GRADE
0.0/ 100
METRIC RATING
296th/ 347
METRIC RANK
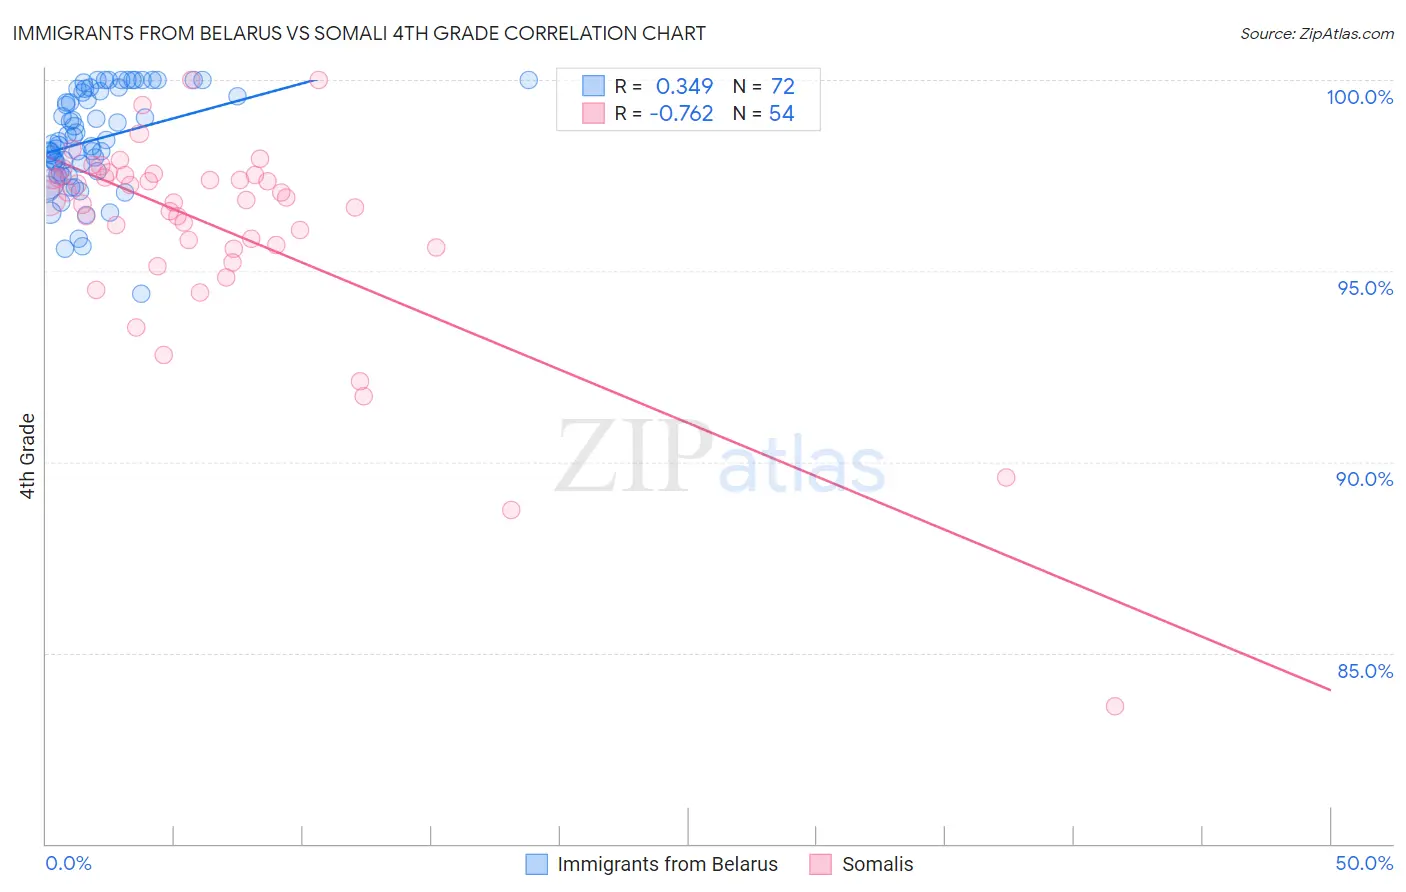
Immigrants from Belarus vs Somali 4th Grade Correlation Chart
The statistical analysis conducted on geographies consisting of 149,993,317 people shows a mild positive correlation between the proportion of Immigrants from Belarus and percentage of population with at least 4th grade education in the United States with a correlation coefficient (R) of 0.349 and weighted average of 97.5%. Similarly, the statistical analysis conducted on geographies consisting of 99,332,457 people shows a strong negative correlation between the proportion of Somalis and percentage of population with at least 4th grade education in the United States with a correlation coefficient (R) of -0.762 and weighted average of 96.6%, a difference of 0.94%.
4th Grade Correlation Summary
| Measurement | Immigrants from Belarus | Somali |
| Minimum | 94.4% | 83.6% |
| Maximum | 100.0% | 100.0% |
| Range | 5.6% | 16.4% |
| Mean | 98.5% | 96.1% |
| Median | 98.4% | 96.9% |
| Interquartile 25% (IQ1) | 97.6% | 95.6% |
| Interquartile 75% (IQ3) | 99.7% | 97.5% |
| Interquartile Range (IQR) | 2.1% | 1.9% |
| Standard Deviation (Sample) | 1.3% | 2.8% |
| Standard Deviation (Population) | 1.3% | 2.8% |
Similar Demographics by 4th Grade
Demographics Similar to Immigrants from Belarus by 4th Grade
In terms of 4th grade, the demographic groups most similar to Immigrants from Belarus are Kenyan (97.5%, a difference of 0.0%), Immigrants from Poland (97.5%, a difference of 0.0%), Ugandan (97.6%, a difference of 0.010%), Venezuelan (97.6%, a difference of 0.010%), and Chilean (97.5%, a difference of 0.010%).
| Demographics | Rating | Rank | 4th Grade |
| Marshallese | 60.8 /100 | #161 | Good 97.6% |
| Bermudans | 60.5 /100 | #162 | Good 97.6% |
| Immigrants | Iran | 60.3 /100 | #163 | Good 97.6% |
| Ugandans | 58.9 /100 | #164 | Average 97.6% |
| Venezuelans | 58.7 /100 | #165 | Average 97.6% |
| Kenyans | 56.5 /100 | #166 | Average 97.5% |
| Immigrants | Poland | 55.9 /100 | #167 | Average 97.5% |
| Immigrants | Belarus | 55.8 /100 | #168 | Average 97.5% |
| Chileans | 54.4 /100 | #169 | Average 97.5% |
| Immigrants | Spain | 51.8 /100 | #170 | Average 97.5% |
| Brazilians | 51.5 /100 | #171 | Average 97.5% |
| Immigrants | Sri Lanka | 51.1 /100 | #172 | Average 97.5% |
| Immigrants | Korea | 50.6 /100 | #173 | Average 97.5% |
| Egyptians | 50.0 /100 | #174 | Average 97.5% |
| Immigrants | Micronesia | 49.6 /100 | #175 | Average 97.5% |
Demographics Similar to Somalis by 4th Grade
In terms of 4th grade, the demographic groups most similar to Somalis are Immigrants from Portugal (96.6%, a difference of 0.010%), Immigrants from Eritrea (96.7%, a difference of 0.030%), Puerto Rican (96.7%, a difference of 0.050%), Malaysian (96.7%, a difference of 0.070%), and Immigrants from Grenada (96.7%, a difference of 0.080%).
| Demographics | Rating | Rank | 4th Grade |
| Immigrants | West Indies | 0.0 /100 | #289 | Tragic 96.7% |
| British West Indians | 0.0 /100 | #290 | Tragic 96.7% |
| Immigrants | Grenada | 0.0 /100 | #291 | Tragic 96.7% |
| Malaysians | 0.0 /100 | #292 | Tragic 96.7% |
| Puerto Ricans | 0.0 /100 | #293 | Tragic 96.7% |
| Immigrants | Eritrea | 0.0 /100 | #294 | Tragic 96.7% |
| Immigrants | Portugal | 0.0 /100 | #295 | Tragic 96.6% |
| Somalis | 0.0 /100 | #296 | Tragic 96.6% |
| Immigrants | Somalia | 0.0 /100 | #297 | Tragic 96.5% |
| Haitians | 0.0 /100 | #298 | Tragic 96.5% |
| Immigrants | Dominica | 0.0 /100 | #299 | Tragic 96.5% |
| Immigrants | South Eastern Asia | 0.0 /100 | #300 | Tragic 96.5% |
| Immigrants | Immigrants | 0.0 /100 | #301 | Tragic 96.5% |
| Immigrants | Cuba | 0.0 /100 | #302 | Tragic 96.4% |
| Guyanese | 0.0 /100 | #303 | Tragic 96.4% |