Immigrants from Belarus vs Finnish Child Poverty Under the Age of 16
COMPARE
Immigrants from Belarus
Finnish
Child Poverty Under the Age of 16
Child Poverty Under the Age of 16 Comparison
Immigrants from Belarus
Finns
14.7%
CHILD POVERTY UNDER THE AGE OF 16
95.7/ 100
METRIC RATING
98th/ 347
METRIC RANK
14.5%
CHILD POVERTY UNDER THE AGE OF 16
97.2/ 100
METRIC RATING
81st/ 347
METRIC RANK
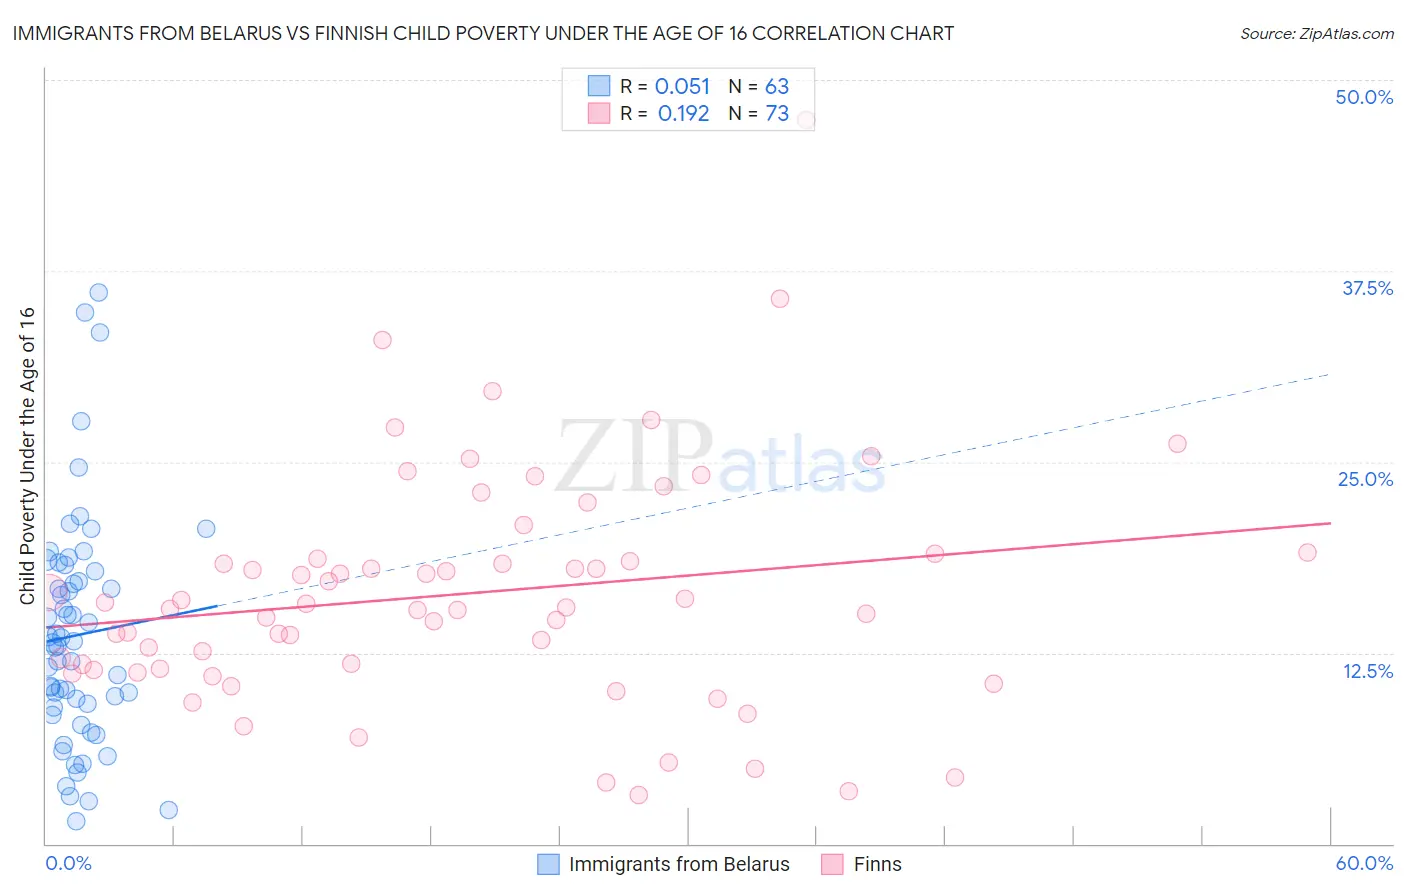
Immigrants from Belarus vs Finnish Child Poverty Under the Age of 16 Correlation Chart
The statistical analysis conducted on geographies consisting of 149,586,337 people shows a slight positive correlation between the proportion of Immigrants from Belarus and poverty level among children under the age of 16 in the United States with a correlation coefficient (R) of 0.051 and weighted average of 14.7%. Similarly, the statistical analysis conducted on geographies consisting of 399,880,934 people shows a poor positive correlation between the proportion of Finns and poverty level among children under the age of 16 in the United States with a correlation coefficient (R) of 0.192 and weighted average of 14.5%, a difference of 1.5%.
Child Poverty Under the Age of 16 Correlation Summary
| Measurement | Immigrants from Belarus | Finnish |
| Minimum | 1.5% | 3.2% |
| Maximum | 36.1% | 47.4% |
| Range | 34.6% | 44.1% |
| Mean | 13.7% | 16.4% |
| Median | 13.1% | 15.4% |
| Interquartile 25% (IQ1) | 8.9% | 11.4% |
| Interquartile 75% (IQ3) | 17.8% | 18.8% |
| Interquartile Range (IQR) | 8.9% | 7.4% |
| Standard Deviation (Sample) | 7.4% | 7.7% |
| Standard Deviation (Population) | 7.4% | 7.7% |
Demographics Similar to Immigrants from Belarus and Finns by Child Poverty Under the Age of 16
In terms of child poverty under the age of 16, the demographic groups most similar to Immigrants from Belarus are Paraguayan (14.7%, a difference of 0.010%), British (14.7%, a difference of 0.12%), Immigrants from France (14.7%, a difference of 0.13%), Immigrants from Croatia (14.6%, a difference of 0.37%), and Immigrants from South Africa (14.6%, a difference of 0.54%). Similarly, the demographic groups most similar to Finns are Immigrants from North Macedonia (14.5%, a difference of 0.030%), Immigrants from Canada (14.5%, a difference of 0.030%), Egyptian (14.5%, a difference of 0.060%), Immigrants from Latvia (14.5%, a difference of 0.080%), and Swiss (14.5%, a difference of 0.10%).
| Demographics | Rating | Rank | Child Poverty Under the Age of 16 |
| Swiss | 97.3 /100 | #79 | Exceptional 14.5% |
| Immigrants | North Macedonia | 97.2 /100 | #80 | Exceptional 14.5% |
| Finns | 97.2 /100 | #81 | Exceptional 14.5% |
| Immigrants | Canada | 97.2 /100 | #82 | Exceptional 14.5% |
| Egyptians | 97.2 /100 | #83 | Exceptional 14.5% |
| Immigrants | Latvia | 97.1 /100 | #84 | Exceptional 14.5% |
| Soviet Union | 97.1 /100 | #85 | Exceptional 14.5% |
| Immigrants | Argentina | 97.1 /100 | #86 | Exceptional 14.5% |
| Taiwanese | 97.1 /100 | #87 | Exceptional 14.5% |
| Northern Europeans | 97.0 /100 | #88 | Exceptional 14.5% |
| Germans | 96.9 /100 | #89 | Exceptional 14.5% |
| Austrians | 96.9 /100 | #90 | Exceptional 14.5% |
| Immigrants | North America | 96.7 /100 | #91 | Exceptional 14.6% |
| Immigrants | Italy | 96.7 /100 | #92 | Exceptional 14.6% |
| Argentineans | 96.6 /100 | #93 | Exceptional 14.6% |
| Immigrants | South Africa | 96.3 /100 | #94 | Exceptional 14.6% |
| Immigrants | Croatia | 96.1 /100 | #95 | Exceptional 14.6% |
| Immigrants | France | 95.8 /100 | #96 | Exceptional 14.7% |
| Paraguayans | 95.7 /100 | #97 | Exceptional 14.7% |
| Immigrants | Belarus | 95.7 /100 | #98 | Exceptional 14.7% |
| British | 95.5 /100 | #99 | Exceptional 14.7% |