Immigrants from Belarus vs Finnish Unemployment Among Ages 20 to 24 years
COMPARE
Immigrants from Belarus
Finnish
Unemployment Among Ages 20 to 24 years
Unemployment Among Ages 20 to 24 years Comparison
Immigrants from Belarus
Finns
10.7%
UNEMPLOYMENT AMONG AGES 20 TO 24 YEARS
1.3/ 100
METRIC RATING
243rd/ 347
METRIC RANK
9.7%
UNEMPLOYMENT AMONG AGES 20 TO 24 YEARS
99.8/ 100
METRIC RATING
48th/ 347
METRIC RANK
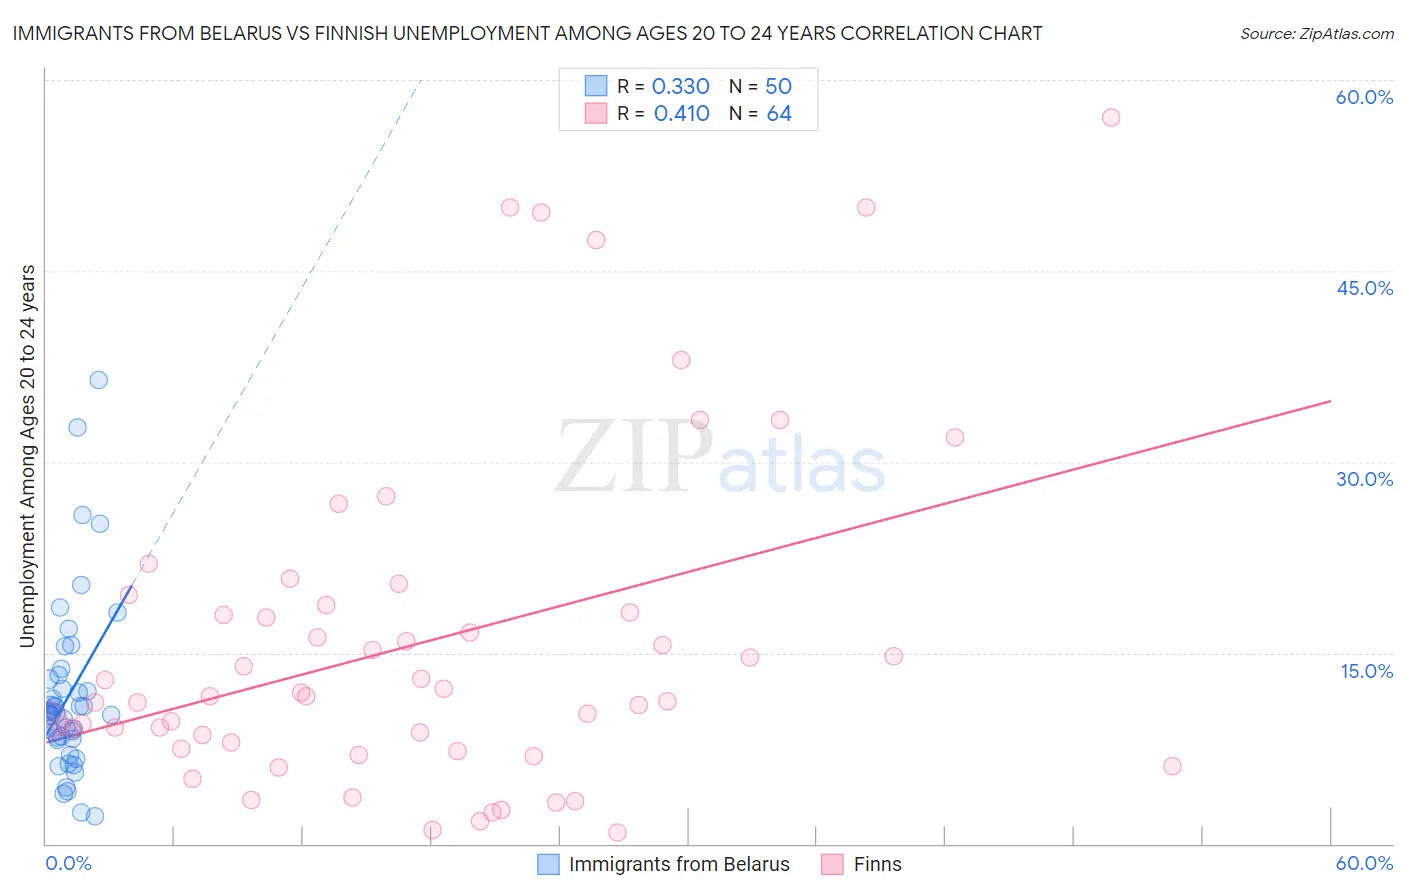
Immigrants from Belarus vs Finnish Unemployment Among Ages 20 to 24 years Correlation Chart
The statistical analysis conducted on geographies consisting of 148,374,360 people shows a mild positive correlation between the proportion of Immigrants from Belarus and unemployment rate among population between the ages 20 and 24 in the United States with a correlation coefficient (R) of 0.330 and weighted average of 10.7%. Similarly, the statistical analysis conducted on geographies consisting of 386,709,686 people shows a moderate positive correlation between the proportion of Finns and unemployment rate among population between the ages 20 and 24 in the United States with a correlation coefficient (R) of 0.410 and weighted average of 9.7%, a difference of 10.2%.
Unemployment Among Ages 20 to 24 years Correlation Summary
| Measurement | Immigrants from Belarus | Finnish |
| Minimum | 2.2% | 0.90% |
| Maximum | 36.4% | 57.1% |
| Range | 34.2% | 56.2% |
| Mean | 11.6% | 15.8% |
| Median | 10.3% | 11.6% |
| Interquartile 25% (IQ1) | 8.2% | 7.7% |
| Interquartile 75% (IQ3) | 13.0% | 18.4% |
| Interquartile Range (IQR) | 4.8% | 10.7% |
| Standard Deviation (Sample) | 6.8% | 13.1% |
| Standard Deviation (Population) | 6.8% | 13.0% |
Similar Demographics by Unemployment Among Ages 20 to 24 years
Demographics Similar to Immigrants from Belarus by Unemployment Among Ages 20 to 24 years
In terms of unemployment among ages 20 to 24 years, the demographic groups most similar to Immigrants from Belarus are Moroccan (10.7%, a difference of 0.040%), Immigrants from Mexico (10.7%, a difference of 0.060%), Immigrants from El Salvador (10.7%, a difference of 0.21%), Hispanic or Latino (10.7%, a difference of 0.25%), and Immigrants from Central America (10.7%, a difference of 0.35%).
| Demographics | Rating | Rank | Unemployment Among Ages 20 to 24 years |
| Mexicans | 3.2 /100 | #236 | Tragic 10.6% |
| Immigrants | Immigrants | 2.7 /100 | #237 | Tragic 10.6% |
| Immigrants | Pakistan | 2.6 /100 | #238 | Tragic 10.6% |
| Salvadorans | 2.4 /100 | #239 | Tragic 10.7% |
| Immigrants | Central America | 2.0 /100 | #240 | Tragic 10.7% |
| Immigrants | El Salvador | 1.7 /100 | #241 | Tragic 10.7% |
| Moroccans | 1.4 /100 | #242 | Tragic 10.7% |
| Immigrants | Belarus | 1.3 /100 | #243 | Tragic 10.7% |
| Immigrants | Mexico | 1.2 /100 | #244 | Tragic 10.7% |
| Hispanics or Latinos | 1.0 /100 | #245 | Tragic 10.7% |
| Immigrants | Iran | 0.9 /100 | #246 | Tragic 10.8% |
| Immigrants | Albania | 0.7 /100 | #247 | Tragic 10.8% |
| Cree | 0.6 /100 | #248 | Tragic 10.8% |
| South American Indians | 0.5 /100 | #249 | Tragic 10.8% |
| Albanians | 0.5 /100 | #250 | Tragic 10.8% |
Demographics Similar to Finns by Unemployment Among Ages 20 to 24 years
In terms of unemployment among ages 20 to 24 years, the demographic groups most similar to Finns are Immigrants from India (9.7%, a difference of 0.010%), Creek (9.7%, a difference of 0.080%), Immigrants from Nicaragua (9.7%, a difference of 0.13%), Croatian (9.7%, a difference of 0.14%), and European (9.7%, a difference of 0.20%).
| Demographics | Rating | Rank | Unemployment Among Ages 20 to 24 years |
| Swiss | 99.9 /100 | #41 | Exceptional 9.7% |
| Immigrants | Saudi Arabia | 99.9 /100 | #42 | Exceptional 9.7% |
| Menominee | 99.8 /100 | #43 | Exceptional 9.7% |
| Europeans | 99.8 /100 | #44 | Exceptional 9.7% |
| Croatians | 99.8 /100 | #45 | Exceptional 9.7% |
| Immigrants | Nicaragua | 99.8 /100 | #46 | Exceptional 9.7% |
| Immigrants | India | 99.8 /100 | #47 | Exceptional 9.7% |
| Finns | 99.8 /100 | #48 | Exceptional 9.7% |
| Creek | 99.8 /100 | #49 | Exceptional 9.7% |
| Immigrants | Kenya | 99.7 /100 | #50 | Exceptional 9.7% |
| Ethiopians | 99.7 /100 | #51 | Exceptional 9.8% |
| Immigrants | Thailand | 99.7 /100 | #52 | Exceptional 9.8% |
| Immigrants | Serbia | 99.6 /100 | #53 | Exceptional 9.8% |
| Immigrants | Cambodia | 99.6 /100 | #54 | Exceptional 9.8% |
| Carpatho Rusyns | 99.6 /100 | #55 | Exceptional 9.8% |