Immigrants from Belarus vs Finnish In Labor Force | Age 16-19
COMPARE
Immigrants from Belarus
Finnish
In Labor Force | Age 16-19
In Labor Force | Age 16-19 Comparison
Immigrants from Belarus
Finns
33.4%
IN LABOR FORCE | AGE 16-19
0.1/ 100
METRIC RATING
291st/ 347
METRIC RANK
43.9%
IN LABOR FORCE | AGE 16-19
100.0/ 100
METRIC RATING
12th/ 347
METRIC RANK
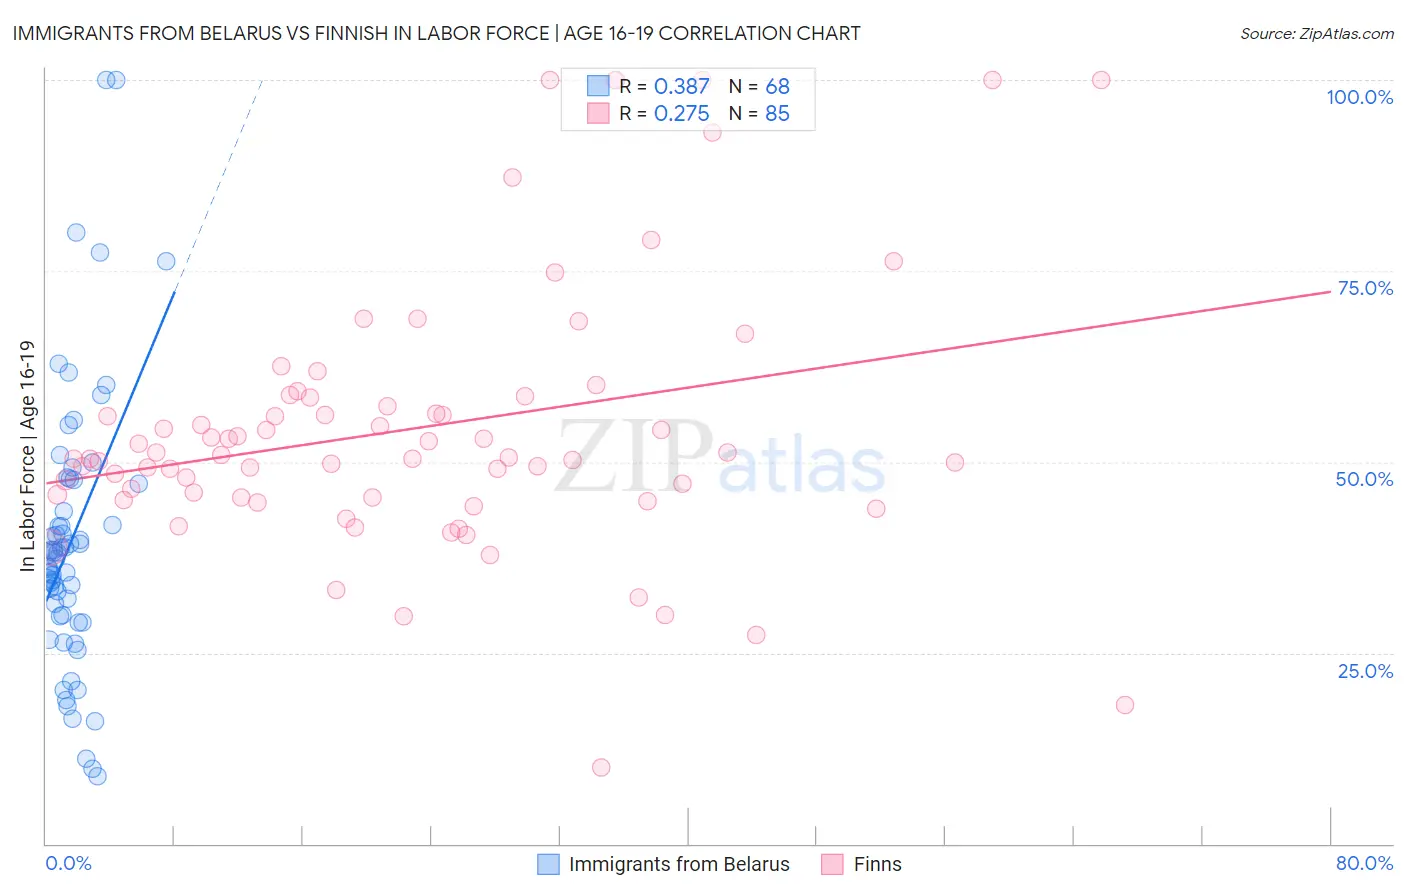
Immigrants from Belarus vs Finnish In Labor Force | Age 16-19 Correlation Chart
The statistical analysis conducted on geographies consisting of 150,086,766 people shows a mild positive correlation between the proportion of Immigrants from Belarus and labor force participation rate among population between the ages 16 and 19 in the United States with a correlation coefficient (R) of 0.387 and weighted average of 33.4%. Similarly, the statistical analysis conducted on geographies consisting of 403,764,919 people shows a weak positive correlation between the proportion of Finns and labor force participation rate among population between the ages 16 and 19 in the United States with a correlation coefficient (R) of 0.275 and weighted average of 43.9%, a difference of 31.4%.
In Labor Force | Age 16-19 Correlation Summary
| Measurement | Immigrants from Belarus | Finnish |
| Minimum | 8.8% | 10.0% |
| Maximum | 100.0% | 100.0% |
| Range | 91.2% | 90.0% |
| Mean | 39.8% | 54.5% |
| Median | 38.0% | 50.6% |
| Interquartile 25% (IQ1) | 29.9% | 45.4% |
| Interquartile 75% (IQ3) | 47.4% | 58.5% |
| Interquartile Range (IQR) | 17.5% | 13.1% |
| Standard Deviation (Sample) | 18.1% | 17.8% |
| Standard Deviation (Population) | 17.9% | 17.7% |
Similar Demographics by In Labor Force | Age 16-19
Demographics Similar to Immigrants from Belarus by In Labor Force | Age 16-19
In terms of in labor force | age 16-19, the demographic groups most similar to Immigrants from Belarus are Haitian (33.4%, a difference of 0.060%), Immigrants from Colombia (33.5%, a difference of 0.080%), Immigrants from Singapore (33.5%, a difference of 0.21%), Immigrants from Indonesia (33.5%, a difference of 0.22%), and Nepalese (33.5%, a difference of 0.25%).
| Demographics | Rating | Rank | In Labor Force | Age 16-19 |
| Immigrants | Spain | 0.2 /100 | #284 | Tragic 33.7% |
| U.S. Virgin Islanders | 0.2 /100 | #285 | Tragic 33.6% |
| South Americans | 0.2 /100 | #286 | Tragic 33.6% |
| Nepalese | 0.1 /100 | #287 | Tragic 33.5% |
| Immigrants | Indonesia | 0.1 /100 | #288 | Tragic 33.5% |
| Immigrants | Singapore | 0.1 /100 | #289 | Tragic 33.5% |
| Immigrants | Colombia | 0.1 /100 | #290 | Tragic 33.5% |
| Immigrants | Belarus | 0.1 /100 | #291 | Tragic 33.4% |
| Haitians | 0.1 /100 | #292 | Tragic 33.4% |
| Immigrants | South America | 0.1 /100 | #293 | Tragic 33.3% |
| Argentineans | 0.1 /100 | #294 | Tragic 33.3% |
| Yup'ik | 0.1 /100 | #295 | Tragic 33.3% |
| Jamaicans | 0.1 /100 | #296 | Tragic 33.2% |
| Immigrants | Haiti | 0.1 /100 | #297 | Tragic 33.2% |
| Iranians | 0.0 /100 | #298 | Tragic 33.0% |
Demographics Similar to Finns by In Labor Force | Age 16-19
In terms of in labor force | age 16-19, the demographic groups most similar to Finns are Dutch (43.8%, a difference of 0.19%), Chippewa (43.8%, a difference of 0.29%), Swedish (44.1%, a difference of 0.46%), German (44.2%, a difference of 0.54%), and Slovene (43.7%, a difference of 0.55%).
| Demographics | Rating | Rank | In Labor Force | Age 16-19 |
| Alaskan Athabascans | 100.0 /100 | #5 | Exceptional 45.2% |
| Somalis | 100.0 /100 | #6 | Exceptional 45.1% |
| Danes | 100.0 /100 | #7 | Exceptional 44.7% |
| Immigrants | Cabo Verde | 100.0 /100 | #8 | Exceptional 44.7% |
| Cape Verdeans | 100.0 /100 | #9 | Exceptional 44.5% |
| Germans | 100.0 /100 | #10 | Exceptional 44.2% |
| Swedes | 100.0 /100 | #11 | Exceptional 44.1% |
| Finns | 100.0 /100 | #12 | Exceptional 43.9% |
| Dutch | 100.0 /100 | #13 | Exceptional 43.8% |
| Chippewa | 100.0 /100 | #14 | Exceptional 43.8% |
| Slovenes | 100.0 /100 | #15 | Exceptional 43.7% |
| Czechs | 100.0 /100 | #16 | Exceptional 43.6% |
| Scandinavians | 100.0 /100 | #17 | Exceptional 43.6% |
| French Canadians | 100.0 /100 | #18 | Exceptional 43.6% |
| Belgians | 100.0 /100 | #19 | Exceptional 43.4% |