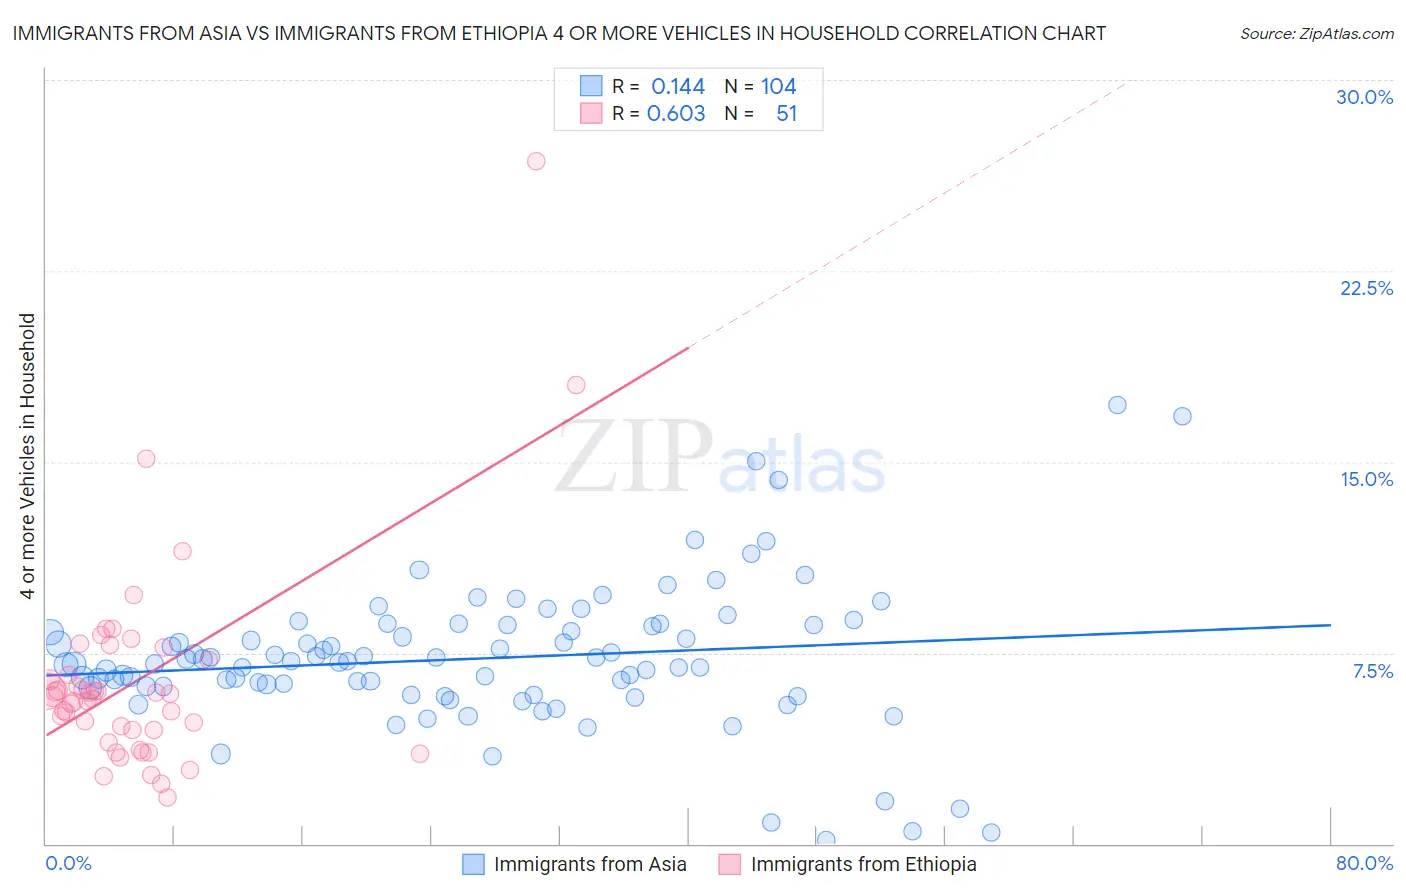
Immigrants from Asia vs Immigrants from Ethiopia 4 or more Vehicles in Household
COMPARE
Immigrants from Asia
Immigrants from Ethiopia
4 or more Vehicles in Household
4 or more Vehicles in Household Comparison
Immigrants from Asia
Immigrants from Ethiopia
6.8%
4 OR MORE VEHICLES IN HOUSEHOLD
94.4/ 100
METRIC RATING
124th/ 347
METRIC RANK
5.7%
4 OR MORE VEHICLES IN HOUSEHOLD
2.4/ 100
METRIC RATING
247th/ 347
METRIC RANK
Immigrants from Asia vs Immigrants from Ethiopia 4 or more Vehicles in Household Correlation Chart
The statistical analysis conducted on geographies consisting of 545,943,212 people shows a poor positive correlation between the proportion of Immigrants from Asia and percentage of households with 4 or more vehicles available in the United States with a correlation coefficient (R) of 0.144 and weighted average of 6.8%. Similarly, the statistical analysis conducted on geographies consisting of 210,800,078 people shows a significant positive correlation between the proportion of Immigrants from Ethiopia and percentage of households with 4 or more vehicles available in the United States with a correlation coefficient (R) of 0.603 and weighted average of 5.7%, a difference of 18.1%.
4 or more Vehicles in Household Correlation Summary
| Measurement | Immigrants from Asia | Immigrants from Ethiopia |
| Minimum | 0.13% | 1.8% |
| Maximum | 17.2% | 26.8% |
| Range | 17.1% | 24.9% |
| Mean | 7.3% | 6.4% |
| Median | 7.2% | 5.8% |
| Interquartile 25% (IQ1) | 6.2% | 4.5% |
| Interquartile 75% (IQ3) | 8.6% | 7.2% |
| Interquartile Range (IQR) | 2.4% | 2.7% |
| Standard Deviation (Sample) | 2.8% | 4.1% |
| Standard Deviation (Population) | 2.8% | 4.1% |
Similar Demographics by 4 or more Vehicles in Household
Demographics Similar to Immigrants from Asia by 4 or more Vehicles in Household
In terms of 4 or more vehicles in household, the demographic groups most similar to Immigrants from Asia are Immigrants (6.8%, a difference of 0.10%), Austrian (6.8%, a difference of 0.10%), Belgian (6.8%, a difference of 0.10%), Immigrants from Germany (6.8%, a difference of 0.16%), and Immigrants from Nicaragua (6.8%, a difference of 0.16%).
| Demographics | Rating | Rank | 4 or more Vehicles in Household |
| Burmese | 95.7 /100 | #117 | Exceptional 6.8% |
| French American Indians | 95.7 /100 | #118 | Exceptional 6.8% |
| Costa Ricans | 95.5 /100 | #119 | Exceptional 6.8% |
| Comanche | 94.8 /100 | #120 | Exceptional 6.8% |
| Immigrants | Germany | 94.7 /100 | #121 | Exceptional 6.8% |
| Immigrants | Nicaragua | 94.7 /100 | #122 | Exceptional 6.8% |
| Immigrants | Immigrants | 94.6 /100 | #123 | Exceptional 6.8% |
| Immigrants | Asia | 94.4 /100 | #124 | Exceptional 6.8% |
| Austrians | 94.1 /100 | #125 | Exceptional 6.8% |
| Belgians | 94.1 /100 | #126 | Exceptional 6.8% |
| Immigrants | Korea | 93.8 /100 | #127 | Exceptional 6.8% |
| Immigrants | Bolivia | 92.5 /100 | #128 | Exceptional 6.7% |
| Immigrants | England | 92.0 /100 | #129 | Exceptional 6.7% |
| Immigrants | Scotland | 89.0 /100 | #130 | Excellent 6.7% |
| Maltese | 88.4 /100 | #131 | Excellent 6.7% |
Demographics Similar to Immigrants from Ethiopia by 4 or more Vehicles in Household
In terms of 4 or more vehicles in household, the demographic groups most similar to Immigrants from Ethiopia are Immigrants from North Macedonia (5.7%, a difference of 0.030%), Immigrants from Eastern Africa (5.7%, a difference of 0.11%), Immigrants from Southern Europe (5.7%, a difference of 0.13%), Immigrants from Europe (5.7%, a difference of 0.23%), and Ugandan (5.7%, a difference of 0.25%).
| Demographics | Rating | Rank | 4 or more Vehicles in Household |
| Immigrants | Poland | 3.8 /100 | #240 | Tragic 5.8% |
| Mongolians | 3.7 /100 | #241 | Tragic 5.8% |
| Immigrants | Middle Africa | 3.4 /100 | #242 | Tragic 5.8% |
| Immigrants | Czechoslovakia | 3.2 /100 | #243 | Tragic 5.8% |
| Ethiopians | 3.2 /100 | #244 | Tragic 5.8% |
| Bulgarians | 3.1 /100 | #245 | Tragic 5.8% |
| Immigrants | North Macedonia | 2.5 /100 | #246 | Tragic 5.7% |
| Immigrants | Ethiopia | 2.4 /100 | #247 | Tragic 5.7% |
| Immigrants | Eastern Africa | 2.4 /100 | #248 | Tragic 5.7% |
| Immigrants | Southern Europe | 2.3 /100 | #249 | Tragic 5.7% |
| Immigrants | Europe | 2.3 /100 | #250 | Tragic 5.7% |
| Ugandans | 2.2 /100 | #251 | Tragic 5.7% |
| Sub-Saharan Africans | 2.1 /100 | #252 | Tragic 5.7% |
| Immigrants | Cuba | 1.6 /100 | #253 | Tragic 5.7% |
| Immigrants | Panama | 1.5 /100 | #254 | Tragic 5.7% |