Immigrants from Asia vs Scandinavian Unemployment Among Women with Children Ages 6 to 17 years
COMPARE
Immigrants from Asia
Scandinavian
Unemployment Among Women with Children Ages 6 to 17 years
Unemployment Among Women with Children Ages 6 to 17 years Comparison
Immigrants from Asia
Scandinavians
8.1%
UNEMPLOYMENT AMONG WOMEN WITH CHILDREN AGES 6 TO 17 YEARS
100.0/ 100
METRIC RATING
48th/ 347
METRIC RANK
8.6%
UNEMPLOYMENT AMONG WOMEN WITH CHILDREN AGES 6 TO 17 YEARS
98.3/ 100
METRIC RATING
103rd/ 347
METRIC RANK
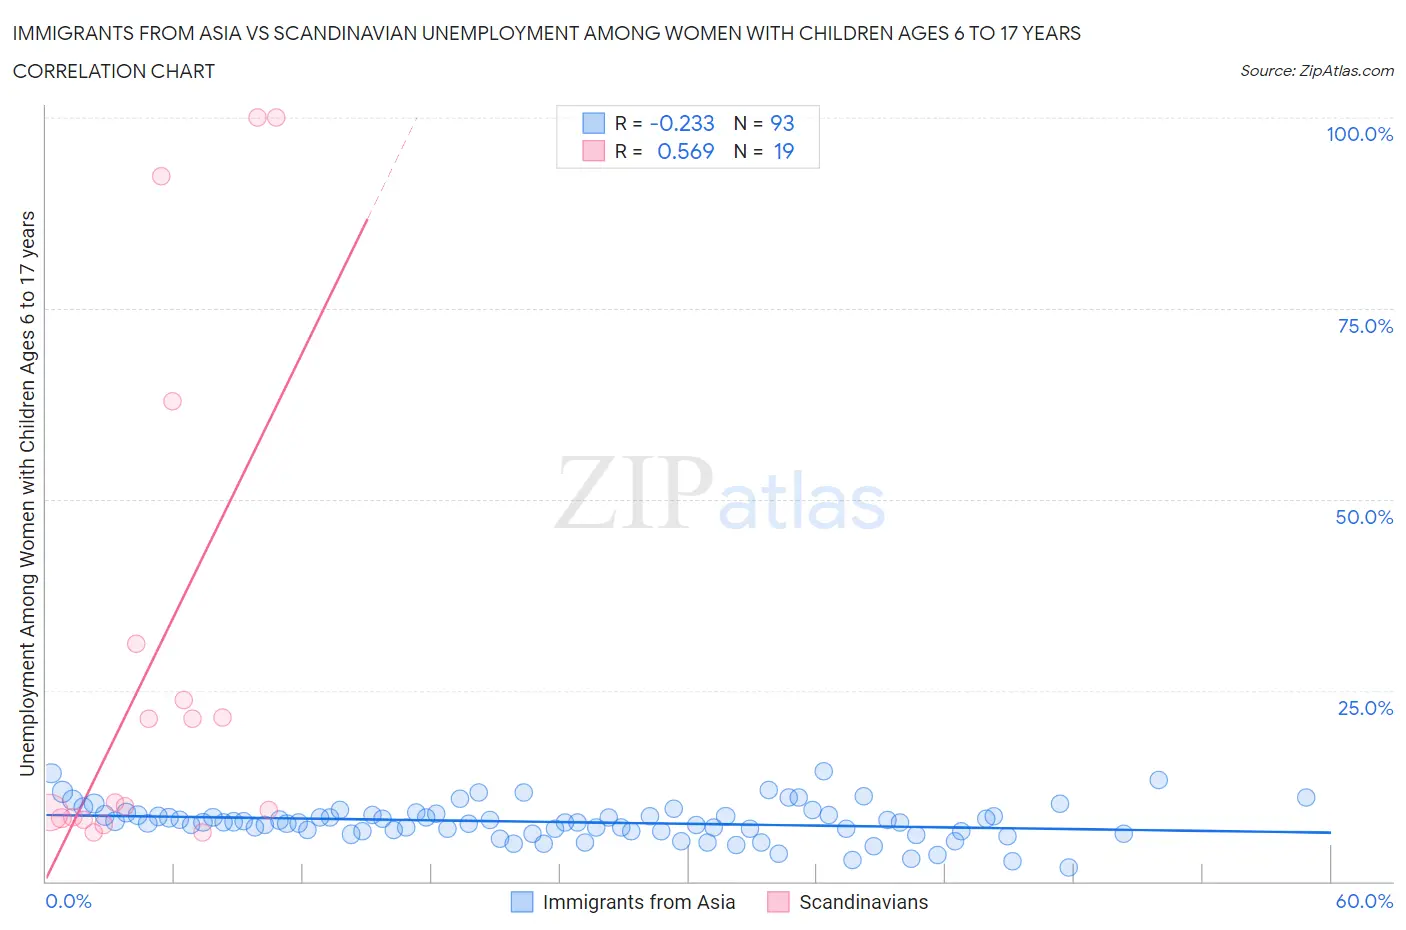
Immigrants from Asia vs Scandinavian Unemployment Among Women with Children Ages 6 to 17 years Correlation Chart
The statistical analysis conducted on geographies consisting of 355,022,689 people shows a weak negative correlation between the proportion of Immigrants from Asia and unemployment rate among women with children between the ages 6 and 17 in the United States with a correlation coefficient (R) of -0.233 and weighted average of 8.1%. Similarly, the statistical analysis conducted on geographies consisting of 313,345,365 people shows a substantial positive correlation between the proportion of Scandinavians and unemployment rate among women with children between the ages 6 and 17 in the United States with a correlation coefficient (R) of 0.569 and weighted average of 8.6%, a difference of 5.9%.
Unemployment Among Women with Children Ages 6 to 17 years Correlation Summary
| Measurement | Immigrants from Asia | Scandinavian |
| Minimum | 1.9% | 6.3% |
| Maximum | 14.4% | 100.0% |
| Range | 12.6% | 93.7% |
| Mean | 7.8% | 29.3% |
| Median | 7.7% | 10.3% |
| Interquartile 25% (IQ1) | 6.5% | 8.3% |
| Interquartile 75% (IQ3) | 8.7% | 31.1% |
| Interquartile Range (IQR) | 2.1% | 22.8% |
| Standard Deviation (Sample) | 2.4% | 33.1% |
| Standard Deviation (Population) | 2.4% | 32.2% |
Similar Demographics by Unemployment Among Women with Children Ages 6 to 17 years
Demographics Similar to Immigrants from Asia by Unemployment Among Women with Children Ages 6 to 17 years
In terms of unemployment among women with children ages 6 to 17 years, the demographic groups most similar to Immigrants from Asia are Immigrants from Oceania (8.1%, a difference of 0.060%), Immigrants from Switzerland (8.1%, a difference of 0.13%), Hawaiian (8.1%, a difference of 0.16%), Icelander (8.1%, a difference of 0.17%), and Immigrants from Bulgaria (8.1%, a difference of 0.18%).
| Demographics | Rating | Rank | Unemployment Among Women with Children Ages 6 to 17 years |
| Iranians | 100.0 /100 | #41 | Exceptional 8.0% |
| Immigrants | Somalia | 100.0 /100 | #42 | Exceptional 8.0% |
| Bhutanese | 100.0 /100 | #43 | Exceptional 8.1% |
| Immigrants | Sweden | 100.0 /100 | #44 | Exceptional 8.1% |
| Immigrants | Bulgaria | 100.0 /100 | #45 | Exceptional 8.1% |
| Icelanders | 100.0 /100 | #46 | Exceptional 8.1% |
| Immigrants | Switzerland | 100.0 /100 | #47 | Exceptional 8.1% |
| Immigrants | Asia | 100.0 /100 | #48 | Exceptional 8.1% |
| Immigrants | Oceania | 100.0 /100 | #49 | Exceptional 8.1% |
| Hawaiians | 100.0 /100 | #50 | Exceptional 8.1% |
| Immigrants | Sudan | 100.0 /100 | #51 | Exceptional 8.1% |
| Immigrants | Iraq | 100.0 /100 | #52 | Exceptional 8.1% |
| Danes | 100.0 /100 | #53 | Exceptional 8.1% |
| Immigrants | Armenia | 100.0 /100 | #54 | Exceptional 8.2% |
| Immigrants | Japan | 100.0 /100 | #55 | Exceptional 8.2% |
Demographics Similar to Scandinavians by Unemployment Among Women with Children Ages 6 to 17 years
In terms of unemployment among women with children ages 6 to 17 years, the demographic groups most similar to Scandinavians are Immigrants from South Africa (8.6%, a difference of 0.010%), Immigrants from Pakistan (8.6%, a difference of 0.030%), Immigrants from Lithuania (8.6%, a difference of 0.040%), New Zealander (8.6%, a difference of 0.040%), and Malaysian (8.6%, a difference of 0.11%).
| Demographics | Rating | Rank | Unemployment Among Women with Children Ages 6 to 17 years |
| German Russians | 98.6 /100 | #96 | Exceptional 8.5% |
| Bolivians | 98.5 /100 | #97 | Exceptional 8.5% |
| Malaysians | 98.5 /100 | #98 | Exceptional 8.6% |
| Immigrants | Lithuania | 98.4 /100 | #99 | Exceptional 8.6% |
| New Zealanders | 98.4 /100 | #100 | Exceptional 8.6% |
| Immigrants | Pakistan | 98.4 /100 | #101 | Exceptional 8.6% |
| Immigrants | South Africa | 98.3 /100 | #102 | Exceptional 8.6% |
| Scandinavians | 98.3 /100 | #103 | Exceptional 8.6% |
| Immigrants | France | 98.0 /100 | #104 | Exceptional 8.6% |
| Immigrants | Norway | 97.8 /100 | #105 | Exceptional 8.6% |
| Immigrants | Serbia | 97.7 /100 | #106 | Exceptional 8.6% |
| Chickasaw | 97.6 /100 | #107 | Exceptional 8.6% |
| Swedes | 97.6 /100 | #108 | Exceptional 8.6% |
| Immigrants | Romania | 97.5 /100 | #109 | Exceptional 8.6% |
| Latvians | 97.4 /100 | #110 | Exceptional 8.6% |