Immigrants from Asia vs Scandinavian Female Unemployment
COMPARE
Immigrants from Asia
Scandinavian
Female Unemployment
Female Unemployment Comparison
Immigrants from Asia
Scandinavians
5.2%
FEMALE UNEMPLOYMENT
64.3/ 100
METRIC RATING
163rd/ 347
METRIC RANK
4.6%
FEMALE UNEMPLOYMENT
100.0/ 100
METRIC RATING
11th/ 347
METRIC RANK
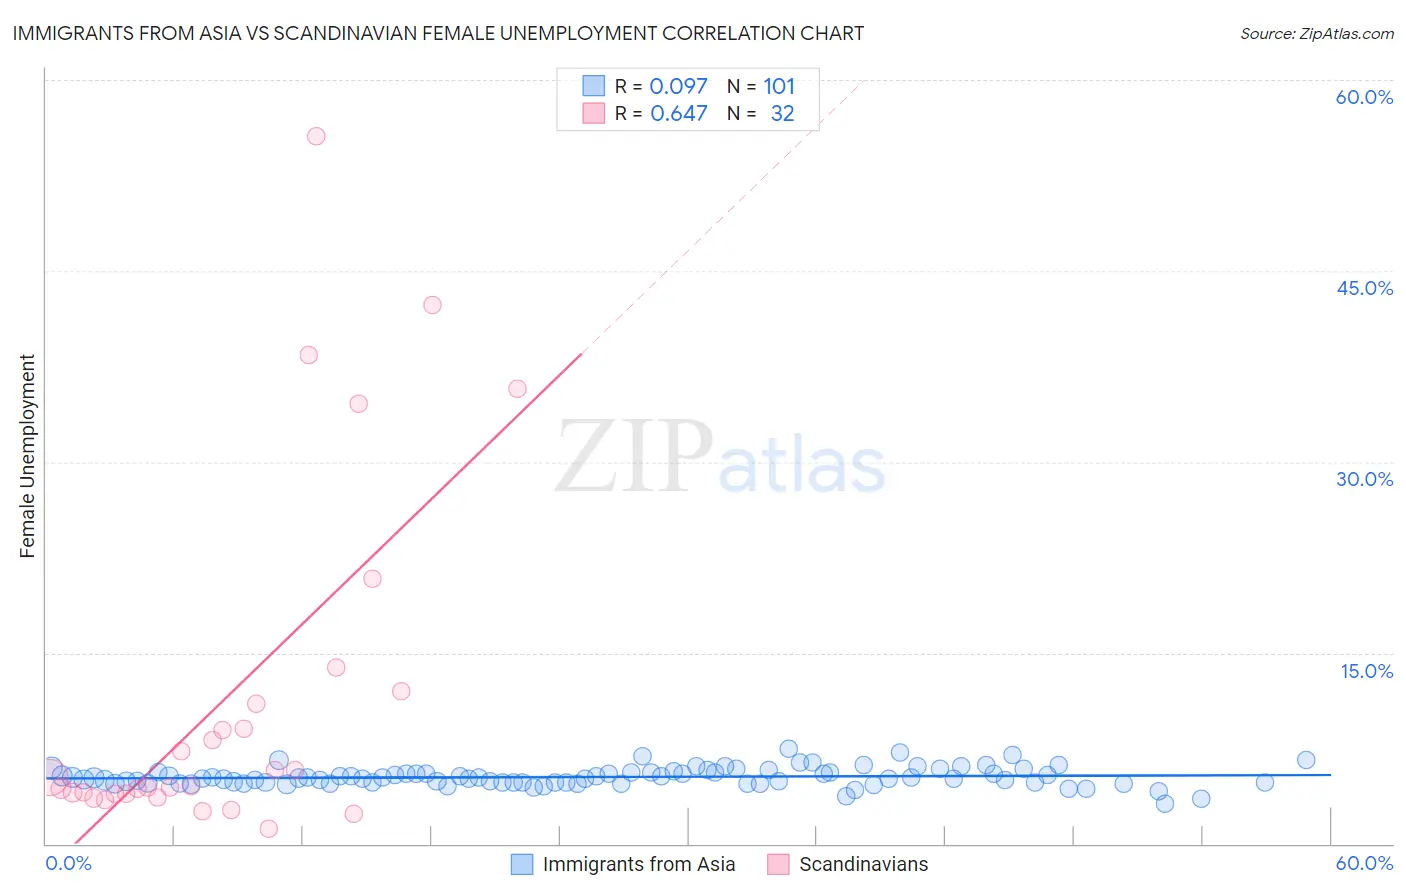
Immigrants from Asia vs Scandinavian Female Unemployment Correlation Chart
The statistical analysis conducted on geographies consisting of 540,737,875 people shows a slight positive correlation between the proportion of Immigrants from Asia and unemploymnet rate among females in the United States with a correlation coefficient (R) of 0.097 and weighted average of 5.2%. Similarly, the statistical analysis conducted on geographies consisting of 466,355,469 people shows a significant positive correlation between the proportion of Scandinavians and unemploymnet rate among females in the United States with a correlation coefficient (R) of 0.647 and weighted average of 4.6%, a difference of 14.2%.
Female Unemployment Correlation Summary
| Measurement | Immigrants from Asia | Scandinavian |
| Minimum | 3.1% | 1.2% |
| Maximum | 7.5% | 55.6% |
| Range | 4.4% | 54.4% |
| Mean | 5.2% | 11.6% |
| Median | 5.2% | 4.9% |
| Interquartile 25% (IQ1) | 4.8% | 3.9% |
| Interquartile 75% (IQ3) | 5.6% | 11.5% |
| Interquartile Range (IQR) | 0.82% | 7.6% |
| Standard Deviation (Sample) | 0.72% | 13.9% |
| Standard Deviation (Population) | 0.72% | 13.7% |
Similar Demographics by Female Unemployment
Demographics Similar to Immigrants from Asia by Female Unemployment
In terms of female unemployment, the demographic groups most similar to Immigrants from Asia are Bangladeshi (5.2%, a difference of 0.0%), Syrian (5.2%, a difference of 0.10%), Native Hawaiian (5.2%, a difference of 0.10%), Potawatomi (5.2%, a difference of 0.11%), and Immigrants from Thailand (5.2%, a difference of 0.14%).
| Demographics | Rating | Rank | Female Unemployment |
| Immigrants | Northern Africa | 69.6 /100 | #156 | Good 5.2% |
| Immigrants | Russia | 69.3 /100 | #157 | Good 5.2% |
| Albanians | 68.3 /100 | #158 | Good 5.2% |
| Immigrants | Micronesia | 66.9 /100 | #159 | Good 5.2% |
| Immigrants | Spain | 66.8 /100 | #160 | Good 5.2% |
| Immigrants | Pakistan | 66.7 /100 | #161 | Good 5.2% |
| Potawatomi | 65.9 /100 | #162 | Good 5.2% |
| Immigrants | Asia | 64.3 /100 | #163 | Good 5.2% |
| Bangladeshis | 64.3 /100 | #164 | Good 5.2% |
| Syrians | 62.8 /100 | #165 | Good 5.2% |
| Native Hawaiians | 62.7 /100 | #166 | Good 5.2% |
| Immigrants | Thailand | 62.1 /100 | #167 | Good 5.2% |
| Sri Lankans | 59.4 /100 | #168 | Average 5.2% |
| Immigrants | Chile | 59.0 /100 | #169 | Average 5.2% |
| Spanish | 55.9 /100 | #170 | Average 5.2% |
Demographics Similar to Scandinavians by Female Unemployment
In terms of female unemployment, the demographic groups most similar to Scandinavians are Swiss (4.6%, a difference of 0.11%), Dutch (4.6%, a difference of 0.59%), Belgian (4.6%, a difference of 0.75%), Finnish (4.6%, a difference of 1.3%), and Slovene (4.5%, a difference of 1.4%).
| Demographics | Rating | Rank | Female Unemployment |
| Danes | 100.0 /100 | #4 | Exceptional 4.4% |
| Hmong | 100.0 /100 | #5 | Exceptional 4.4% |
| Swedes | 100.0 /100 | #6 | Exceptional 4.4% |
| Chinese | 100.0 /100 | #7 | Exceptional 4.5% |
| Germans | 100.0 /100 | #8 | Exceptional 4.5% |
| Slovenes | 100.0 /100 | #9 | Exceptional 4.5% |
| Swiss | 100.0 /100 | #10 | Exceptional 4.6% |
| Scandinavians | 100.0 /100 | #11 | Exceptional 4.6% |
| Dutch | 100.0 /100 | #12 | Exceptional 4.6% |
| Belgians | 100.0 /100 | #13 | Exceptional 4.6% |
| Finns | 100.0 /100 | #14 | Exceptional 4.6% |
| English | 100.0 /100 | #15 | Exceptional 4.6% |
| Carpatho Rusyns | 99.9 /100 | #16 | Exceptional 4.7% |
| Croatians | 99.9 /100 | #17 | Exceptional 4.7% |
| Latvians | 99.9 /100 | #18 | Exceptional 4.7% |