Paiute vs Barbadian 3 or more Vehicles in Household
COMPARE
Paiute
Barbadian
3 or more Vehicles in Household
3 or more Vehicles in Household Comparison
Paiute
Barbadians
23.8%
3 OR MORE VEHICLES IN HOUSEHOLD
100.0/ 100
METRIC RATING
20th/ 347
METRIC RANK
12.6%
3 OR MORE VEHICLES IN HOUSEHOLD
0.0/ 100
METRIC RATING
336th/ 347
METRIC RANK
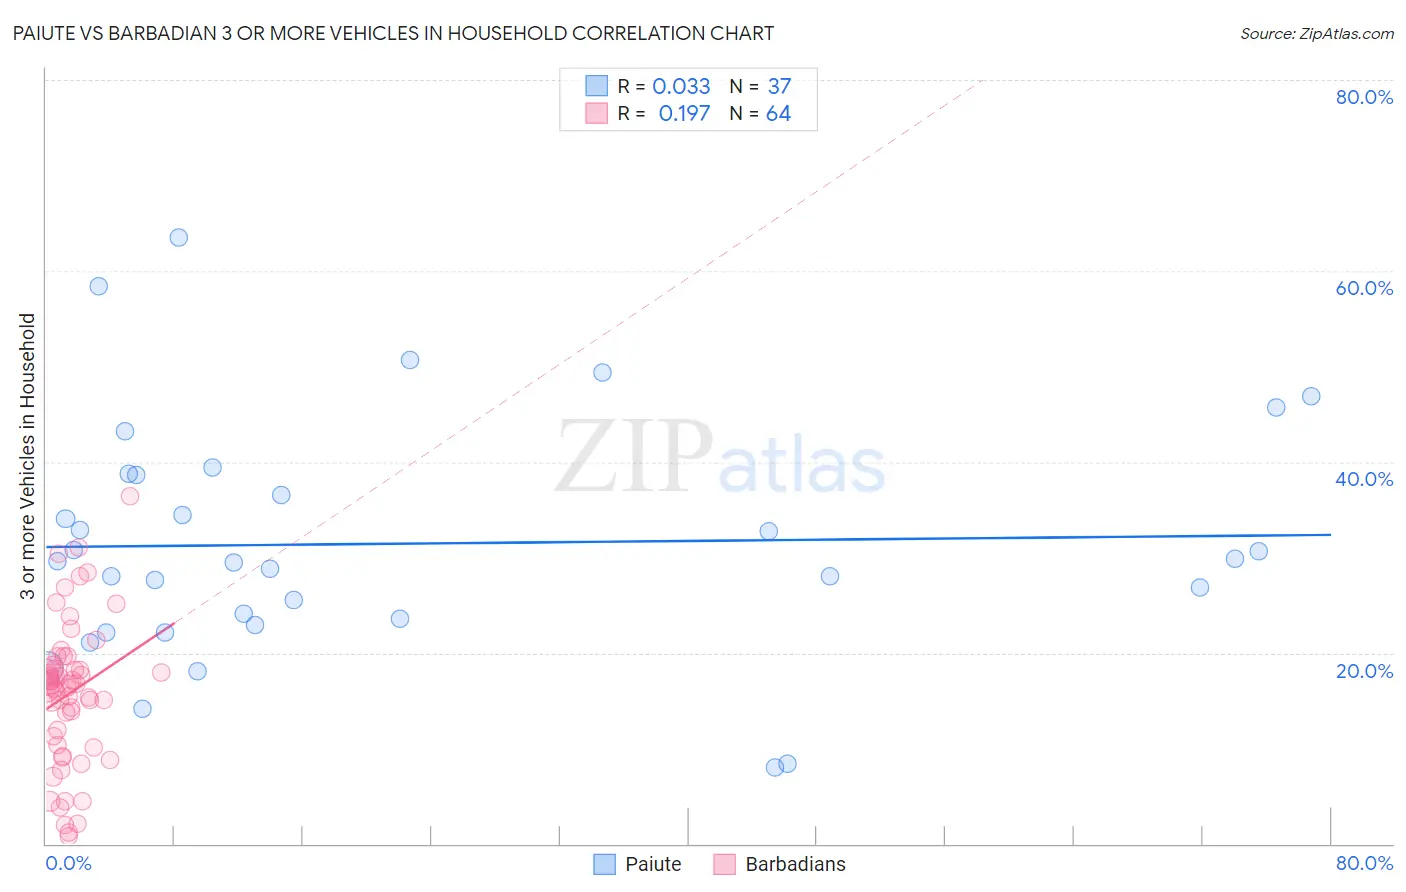
Paiute vs Barbadian 3 or more Vehicles in Household Correlation Chart
The statistical analysis conducted on geographies consisting of 58,394,165 people shows no correlation between the proportion of Paiute and percentage of households with 3 or more vehicles available in the United States with a correlation coefficient (R) of 0.033 and weighted average of 23.8%. Similarly, the statistical analysis conducted on geographies consisting of 141,251,971 people shows a poor positive correlation between the proportion of Barbadians and percentage of households with 3 or more vehicles available in the United States with a correlation coefficient (R) of 0.197 and weighted average of 12.6%, a difference of 89.3%.
3 or more Vehicles in Household Correlation Summary
| Measurement | Paiute | Barbadian |
| Minimum | 7.9% | 0.77% |
| Maximum | 63.5% | 36.4% |
| Range | 55.5% | 35.6% |
| Mean | 31.4% | 15.8% |
| Median | 29.6% | 16.8% |
| Interquartile 25% (IQ1) | 23.2% | 10.8% |
| Interquartile 75% (IQ3) | 38.7% | 18.5% |
| Interquartile Range (IQR) | 15.5% | 7.7% |
| Standard Deviation (Sample) | 12.4% | 7.5% |
| Standard Deviation (Population) | 12.3% | 7.4% |
Similar Demographics by 3 or more Vehicles in Household
Demographics Similar to Paiute by 3 or more Vehicles in Household
In terms of 3 or more vehicles in household, the demographic groups most similar to Paiute are Immigrants from Vietnam (23.8%, a difference of 0.12%), Immigrants from Philippines (23.8%, a difference of 0.18%), Chinese (23.9%, a difference of 0.29%), Norwegian (23.9%, a difference of 0.33%), and Scandinavian (23.6%, a difference of 0.77%).
| Demographics | Rating | Rank | 3 or more Vehicles in Household |
| Mexicans | 100.0 /100 | #13 | Exceptional 24.7% |
| Immigrants | Mexico | 100.0 /100 | #14 | Exceptional 24.6% |
| Hawaiians | 100.0 /100 | #15 | Exceptional 24.3% |
| Basques | 100.0 /100 | #16 | Exceptional 24.3% |
| Koreans | 100.0 /100 | #17 | Exceptional 24.1% |
| Norwegians | 100.0 /100 | #18 | Exceptional 23.9% |
| Chinese | 100.0 /100 | #19 | Exceptional 23.9% |
| Paiute | 100.0 /100 | #20 | Exceptional 23.8% |
| Immigrants | Vietnam | 100.0 /100 | #21 | Exceptional 23.8% |
| Immigrants | Philippines | 100.0 /100 | #22 | Exceptional 23.8% |
| Scandinavians | 100.0 /100 | #23 | Exceptional 23.6% |
| Sri Lankans | 100.0 /100 | #24 | Exceptional 23.6% |
| Immigrants | Central America | 100.0 /100 | #25 | Exceptional 23.4% |
| Mexican American Indians | 100.0 /100 | #26 | Exceptional 23.3% |
| Guamanians/Chamorros | 100.0 /100 | #27 | Exceptional 23.2% |
Demographics Similar to Barbadians by 3 or more Vehicles in Household
In terms of 3 or more vehicles in household, the demographic groups most similar to Barbadians are Immigrants from Bangladesh (12.5%, a difference of 0.44%), Vietnamese (12.5%, a difference of 0.98%), Immigrants from Uzbekistan (12.0%, a difference of 4.9%), Immigrants from Trinidad and Tobago (13.3%, a difference of 6.1%), and Immigrants from Ecuador (13.4%, a difference of 6.6%).
| Demographics | Rating | Rank | 3 or more Vehicles in Household |
| Immigrants | Senegal | 0.0 /100 | #329 | Tragic 13.8% |
| West Indians | 0.0 /100 | #330 | Tragic 13.7% |
| Immigrants | Dominica | 0.0 /100 | #331 | Tragic 13.7% |
| Trinidadians and Tobagonians | 0.0 /100 | #332 | Tragic 13.6% |
| Immigrants | Cabo Verde | 0.0 /100 | #333 | Tragic 13.6% |
| Immigrants | Ecuador | 0.0 /100 | #334 | Tragic 13.4% |
| Immigrants | Trinidad and Tobago | 0.0 /100 | #335 | Tragic 13.3% |
| Barbadians | 0.0 /100 | #336 | Tragic 12.6% |
| Immigrants | Bangladesh | 0.0 /100 | #337 | Tragic 12.5% |
| Vietnamese | 0.0 /100 | #338 | Tragic 12.5% |
| Immigrants | Uzbekistan | 0.0 /100 | #339 | Tragic 12.0% |
| Immigrants | Barbados | 0.0 /100 | #340 | Tragic 11.7% |
| Guyanese | 0.0 /100 | #341 | Tragic 11.5% |
| British West Indians | 0.0 /100 | #342 | Tragic 11.4% |
| Immigrants | Guyana | 0.0 /100 | #343 | Tragic 11.2% |