Immigrants from Asia vs Barbadian Median Family Income
COMPARE
Immigrants from Asia
Barbadian
Median Family Income
Median Family Income Comparison
Immigrants from Asia
Barbadians
$118,291
MEDIAN FAMILY INCOME
100.0/ 100
METRIC RATING
39th/ 347
METRIC RANK
$93,919
MEDIAN FAMILY INCOME
1.1/ 100
METRIC RATING
242nd/ 347
METRIC RANK
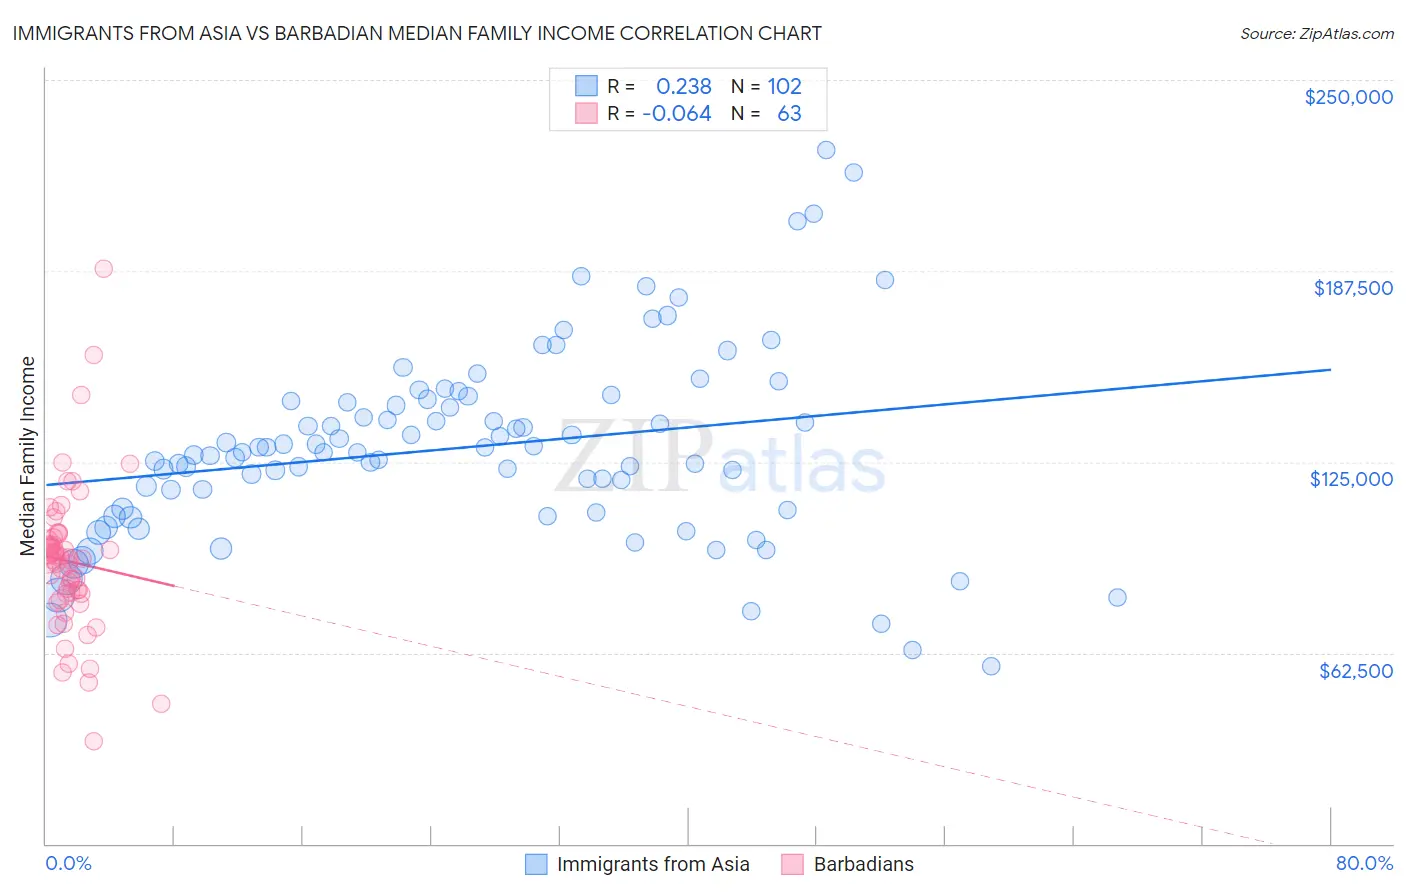
Immigrants from Asia vs Barbadian Median Family Income Correlation Chart
The statistical analysis conducted on geographies consisting of 548,079,334 people shows a weak positive correlation between the proportion of Immigrants from Asia and median family income in the United States with a correlation coefficient (R) of 0.238 and weighted average of $118,291. Similarly, the statistical analysis conducted on geographies consisting of 141,221,123 people shows a slight negative correlation between the proportion of Barbadians and median family income in the United States with a correlation coefficient (R) of -0.064 and weighted average of $93,919, a difference of 26.0%.
Median Family Income Correlation Summary
| Measurement | Immigrants from Asia | Barbadian |
| Minimum | $58,163 | $33,750 |
| Maximum | $227,279 | $188,047 |
| Range | $169,116 | $154,297 |
| Mean | $129,737 | $92,437 |
| Median | $128,095 | $93,405 |
| Interquartile 25% (IQ1) | $109,196 | $81,674 |
| Interquartile 75% (IQ3) | $144,788 | $100,271 |
| Interquartile Range (IQR) | $35,592 | $18,597 |
| Standard Deviation (Sample) | $31,368 | $24,591 |
| Standard Deviation (Population) | $31,213 | $24,395 |
Similar Demographics by Median Family Income
Demographics Similar to Immigrants from Asia by Median Family Income
In terms of median family income, the demographic groups most similar to Immigrants from Asia are Immigrants from Turkey ($118,325, a difference of 0.030%), Australian ($118,440, a difference of 0.13%), Immigrants from Lithuania ($118,053, a difference of 0.20%), Israeli ($118,577, a difference of 0.24%), and Estonian ($118,013, a difference of 0.24%).
| Demographics | Rating | Rank | Median Family Income |
| Asians | 100.0 /100 | #32 | Exceptional $119,955 |
| Bhutanese | 100.0 /100 | #33 | Exceptional $119,800 |
| Bolivians | 100.0 /100 | #34 | Exceptional $119,479 |
| Soviet Union | 100.0 /100 | #35 | Exceptional $119,262 |
| Israelis | 100.0 /100 | #36 | Exceptional $118,577 |
| Australians | 100.0 /100 | #37 | Exceptional $118,440 |
| Immigrants | Turkey | 100.0 /100 | #38 | Exceptional $118,325 |
| Immigrants | Asia | 100.0 /100 | #39 | Exceptional $118,291 |
| Immigrants | Lithuania | 100.0 /100 | #40 | Exceptional $118,053 |
| Estonians | 100.0 /100 | #41 | Exceptional $118,013 |
| Immigrants | Bolivia | 100.0 /100 | #42 | Exceptional $117,912 |
| Bulgarians | 100.0 /100 | #43 | Exceptional $117,818 |
| Cambodians | 100.0 /100 | #44 | Exceptional $117,780 |
| Immigrants | Greece | 99.9 /100 | #45 | Exceptional $117,344 |
| Immigrants | Russia | 99.9 /100 | #46 | Exceptional $116,942 |
Demographics Similar to Barbadians by Median Family Income
In terms of median family income, the demographic groups most similar to Barbadians are German Russian ($93,858, a difference of 0.060%), Immigrants from Trinidad and Tobago ($93,988, a difference of 0.070%), Somali ($94,085, a difference of 0.18%), Subsaharan African ($93,748, a difference of 0.18%), and Salvadoran ($94,109, a difference of 0.20%).
| Demographics | Rating | Rank | Median Family Income |
| Immigrants | Burma/Myanmar | 1.5 /100 | #235 | Tragic $94,472 |
| Trinidadians and Tobagonians | 1.5 /100 | #236 | Tragic $94,466 |
| Alaskan Athabascans | 1.5 /100 | #237 | Tragic $94,429 |
| Nepalese | 1.3 /100 | #238 | Tragic $94,153 |
| Salvadorans | 1.2 /100 | #239 | Tragic $94,109 |
| Somalis | 1.2 /100 | #240 | Tragic $94,085 |
| Immigrants | Trinidad and Tobago | 1.2 /100 | #241 | Tragic $93,988 |
| Barbadians | 1.1 /100 | #242 | Tragic $93,919 |
| German Russians | 1.1 /100 | #243 | Tragic $93,858 |
| Sub-Saharan Africans | 1.0 /100 | #244 | Tragic $93,748 |
| Immigrants | Middle Africa | 1.0 /100 | #245 | Tragic $93,593 |
| Guyanese | 0.9 /100 | #246 | Tragic $93,373 |
| Immigrants | Senegal | 0.7 /100 | #247 | Tragic $92,912 |
| French American Indians | 0.7 /100 | #248 | Tragic $92,872 |
| Immigrants | Ecuador | 0.7 /100 | #249 | Tragic $92,837 |