Immigrants from Albania vs Chippewa 3 or more Vehicles in Household
COMPARE
Immigrants from Albania
Chippewa
3 or more Vehicles in Household
3 or more Vehicles in Household Comparison
Immigrants from Albania
Chippewa
14.0%
3 OR MORE VEHICLES IN HOUSEHOLD
0.0/ 100
METRIC RATING
328th/ 347
METRIC RANK
21.5%
3 OR MORE VEHICLES IN HOUSEHOLD
99.6/ 100
METRIC RATING
83rd/ 347
METRIC RANK
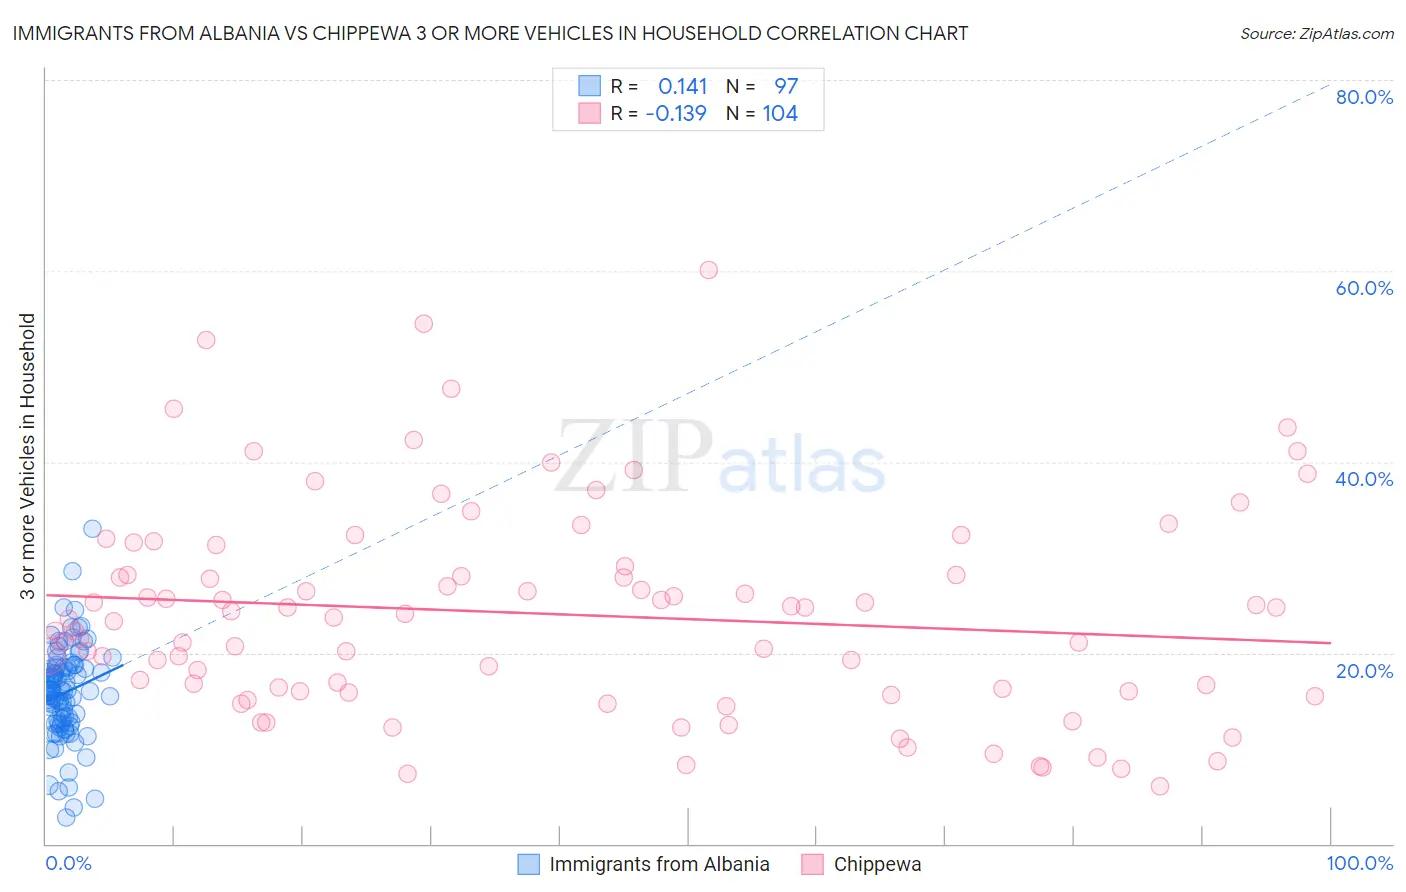
Immigrants from Albania vs Chippewa 3 or more Vehicles in Household Correlation Chart
The statistical analysis conducted on geographies consisting of 119,328,731 people shows a poor positive correlation between the proportion of Immigrants from Albania and percentage of households with 3 or more vehicles available in the United States with a correlation coefficient (R) of 0.141 and weighted average of 14.0%. Similarly, the statistical analysis conducted on geographies consisting of 214,974,955 people shows a poor negative correlation between the proportion of Chippewa and percentage of households with 3 or more vehicles available in the United States with a correlation coefficient (R) of -0.139 and weighted average of 21.5%, a difference of 54.2%.
3 or more Vehicles in Household Correlation Summary
| Measurement | Immigrants from Albania | Chippewa |
| Minimum | 2.7% | 6.0% |
| Maximum | 33.0% | 60.1% |
| Range | 30.3% | 54.1% |
| Mean | 15.8% | 24.1% |
| Median | 16.1% | 23.7% |
| Interquartile 25% (IQ1) | 12.6% | 15.9% |
| Interquartile 75% (IQ3) | 18.4% | 28.6% |
| Interquartile Range (IQR) | 5.8% | 12.7% |
| Standard Deviation (Sample) | 5.0% | 11.0% |
| Standard Deviation (Population) | 5.0% | 11.0% |
Similar Demographics by 3 or more Vehicles in Household
Demographics Similar to Immigrants from Albania by 3 or more Vehicles in Household
In terms of 3 or more vehicles in household, the demographic groups most similar to Immigrants from Albania are Ecuadorian (14.1%, a difference of 0.71%), Immigrants from Senegal (13.8%, a difference of 1.2%), West Indian (13.7%, a difference of 1.5%), Soviet Union (14.2%, a difference of 1.6%), and Immigrants from Dominica (13.7%, a difference of 1.7%).
| Demographics | Rating | Rank | 3 or more Vehicles in Household |
| Immigrants | Jamaica | 0.0 /100 | #321 | Tragic 14.7% |
| Immigrants | West Indies | 0.0 /100 | #322 | Tragic 14.6% |
| Immigrants | Caribbean | 0.0 /100 | #323 | Tragic 14.6% |
| Immigrants | Yemen | 0.0 /100 | #324 | Tragic 14.2% |
| Senegalese | 0.0 /100 | #325 | Tragic 14.2% |
| Soviet Union | 0.0 /100 | #326 | Tragic 14.2% |
| Ecuadorians | 0.0 /100 | #327 | Tragic 14.1% |
| Immigrants | Albania | 0.0 /100 | #328 | Tragic 14.0% |
| Immigrants | Senegal | 0.0 /100 | #329 | Tragic 13.8% |
| West Indians | 0.0 /100 | #330 | Tragic 13.7% |
| Immigrants | Dominica | 0.0 /100 | #331 | Tragic 13.7% |
| Trinidadians and Tobagonians | 0.0 /100 | #332 | Tragic 13.6% |
| Immigrants | Cabo Verde | 0.0 /100 | #333 | Tragic 13.6% |
| Immigrants | Ecuador | 0.0 /100 | #334 | Tragic 13.4% |
| Immigrants | Trinidad and Tobago | 0.0 /100 | #335 | Tragic 13.3% |
Demographics Similar to Chippewa by 3 or more Vehicles in Household
In terms of 3 or more vehicles in household, the demographic groups most similar to Chippewa are Immigrants from El Salvador (21.5%, a difference of 0.030%), Icelander (21.5%, a difference of 0.050%), Laotian (21.5%, a difference of 0.070%), Delaware (21.5%, a difference of 0.14%), and Immigrants from the Azores (21.5%, a difference of 0.26%).
| Demographics | Rating | Rank | 3 or more Vehicles in Household |
| Immigrants | Nonimmigrants | 99.8 /100 | #76 | Exceptional 21.8% |
| Irish | 99.8 /100 | #77 | Exceptional 21.8% |
| Czechoslovakians | 99.8 /100 | #78 | Exceptional 21.7% |
| Assyrians/Chaldeans/Syriacs | 99.8 /100 | #79 | Exceptional 21.7% |
| Afghans | 99.7 /100 | #80 | Exceptional 21.7% |
| Celtics | 99.7 /100 | #81 | Exceptional 21.7% |
| Immigrants | El Salvador | 99.6 /100 | #82 | Exceptional 21.5% |
| Chippewa | 99.6 /100 | #83 | Exceptional 21.5% |
| Icelanders | 99.6 /100 | #84 | Exceptional 21.5% |
| Laotians | 99.6 /100 | #85 | Exceptional 21.5% |
| Delaware | 99.6 /100 | #86 | Exceptional 21.5% |
| Immigrants | Azores | 99.5 /100 | #87 | Exceptional 21.5% |
| French | 99.4 /100 | #88 | Exceptional 21.4% |
| Marshallese | 99.2 /100 | #89 | Exceptional 21.3% |
| Immigrants | Afghanistan | 99.1 /100 | #90 | Exceptional 21.2% |