Honduran vs Pima Female Poverty Among 18-24 Year Olds
COMPARE
Honduran
Pima
Female Poverty Among 18-24 Year Olds
Female Poverty Among 18-24 Year Olds Comparison
Hondurans
Pima
21.5%
FEMALE POVERTY AMONG 18-24 YEAR OLDS
0.3/ 100
METRIC RATING
264th/ 347
METRIC RANK
28.4%
FEMALE POVERTY AMONG 18-24 YEAR OLDS
0.0/ 100
METRIC RATING
339th/ 347
METRIC RANK
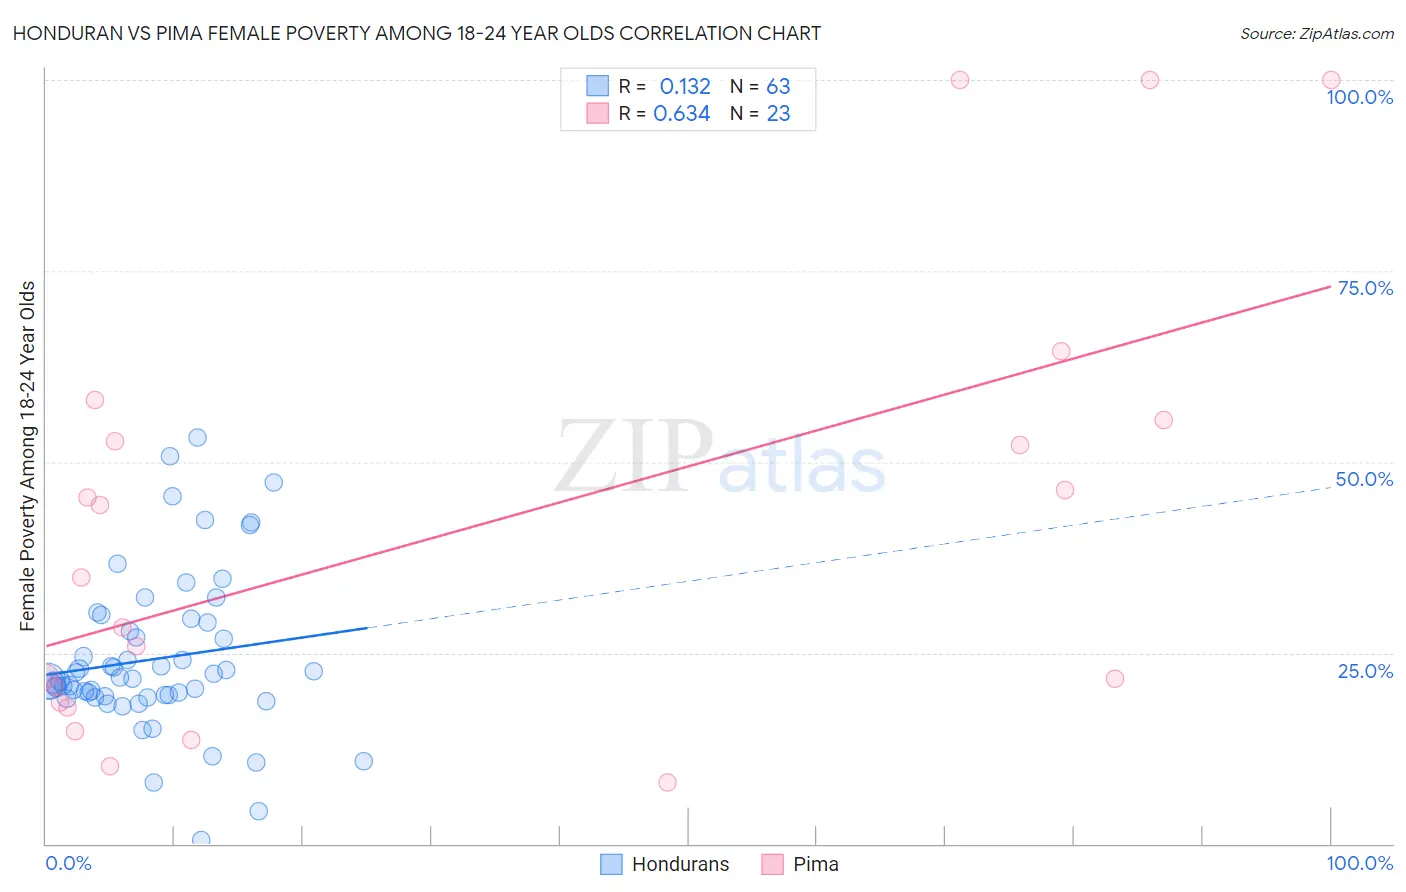
Honduran vs Pima Female Poverty Among 18-24 Year Olds Correlation Chart
The statistical analysis conducted on geographies consisting of 352,497,454 people shows a poor positive correlation between the proportion of Hondurans and poverty level among females between the ages 18 and 24 in the United States with a correlation coefficient (R) of 0.132 and weighted average of 21.5%. Similarly, the statistical analysis conducted on geographies consisting of 61,293,742 people shows a significant positive correlation between the proportion of Pima and poverty level among females between the ages 18 and 24 in the United States with a correlation coefficient (R) of 0.634 and weighted average of 28.4%, a difference of 32.0%.
Female Poverty Among 18-24 Year Olds Correlation Summary
| Measurement | Honduran | Pima |
| Minimum | 0.50% | 8.0% |
| Maximum | 53.1% | 100.0% |
| Range | 52.6% | 92.0% |
| Mean | 24.2% | 41.5% |
| Median | 21.5% | 34.9% |
| Interquartile 25% (IQ1) | 19.3% | 18.5% |
| Interquartile 75% (IQ3) | 28.9% | 55.5% |
| Interquartile Range (IQR) | 9.7% | 37.0% |
| Standard Deviation (Sample) | 10.3% | 28.5% |
| Standard Deviation (Population) | 10.2% | 27.9% |
Similar Demographics by Female Poverty Among 18-24 Year Olds
Demographics Similar to Hondurans by Female Poverty Among 18-24 Year Olds
In terms of female poverty among 18-24 year olds, the demographic groups most similar to Hondurans are Nonimmigrants (21.5%, a difference of 0.010%), Icelander (21.5%, a difference of 0.050%), Alaska Native (21.5%, a difference of 0.070%), American (21.6%, a difference of 0.16%), and Immigrants from Burma/Myanmar (21.6%, a difference of 0.31%).
| Demographics | Rating | Rank | Female Poverty Among 18-24 Year Olds |
| Taiwanese | 1.0 /100 | #257 | Tragic 21.2% |
| Vietnamese | 0.6 /100 | #258 | Tragic 21.4% |
| Immigrants | France | 0.6 /100 | #259 | Tragic 21.4% |
| Immigrants | Norway | 0.6 /100 | #260 | Tragic 21.4% |
| Immigrants | Bahamas | 0.5 /100 | #261 | Tragic 21.4% |
| Immigrants | Eastern Africa | 0.4 /100 | #262 | Tragic 21.4% |
| Icelanders | 0.3 /100 | #263 | Tragic 21.5% |
| Hondurans | 0.3 /100 | #264 | Tragic 21.5% |
| Immigrants | Nonimmigrants | 0.3 /100 | #265 | Tragic 21.5% |
| Alaska Natives | 0.3 /100 | #266 | Tragic 21.5% |
| Americans | 0.3 /100 | #267 | Tragic 21.6% |
| Immigrants | Burma/Myanmar | 0.2 /100 | #268 | Tragic 21.6% |
| Celtics | 0.2 /100 | #269 | Tragic 21.6% |
| Mongolians | 0.2 /100 | #270 | Tragic 21.6% |
| Scotch-Irish | 0.2 /100 | #271 | Tragic 21.6% |
Demographics Similar to Pima by Female Poverty Among 18-24 Year Olds
In terms of female poverty among 18-24 year olds, the demographic groups most similar to Pima are Sioux (28.6%, a difference of 0.55%), Hopi (28.2%, a difference of 0.72%), Cheyenne (28.1%, a difference of 0.94%), Colville (29.0%, a difference of 2.1%), and Kiowa (29.2%, a difference of 2.9%).
| Demographics | Rating | Rank | Female Poverty Among 18-24 Year Olds |
| Houma | 0.0 /100 | #332 | Tragic 26.2% |
| Apache | 0.0 /100 | #333 | Tragic 26.3% |
| Pueblo | 0.0 /100 | #334 | Tragic 26.9% |
| Yup'ik | 0.0 /100 | #335 | Tragic 27.0% |
| Immigrants | Yemen | 0.0 /100 | #336 | Tragic 27.5% |
| Cheyenne | 0.0 /100 | #337 | Tragic 28.1% |
| Hopi | 0.0 /100 | #338 | Tragic 28.2% |
| Pima | 0.0 /100 | #339 | Tragic 28.4% |
| Sioux | 0.0 /100 | #340 | Tragic 28.6% |
| Colville | 0.0 /100 | #341 | Tragic 29.0% |
| Kiowa | 0.0 /100 | #342 | Tragic 29.2% |
| Puerto Ricans | 0.0 /100 | #343 | Tragic 29.8% |
| Navajo | 0.0 /100 | #344 | Tragic 30.3% |
| Tohono O'odham | 0.0 /100 | #345 | Tragic 31.0% |
| Lumbee | 0.0 /100 | #346 | Tragic 31.1% |