Guamanian/Chamorro vs Liberian Unemployment Among Seniors over 75 years
COMPARE
Guamanian/Chamorro
Liberian
Unemployment Among Seniors over 75 years
Unemployment Among Seniors over 75 years Comparison
Guamanians/Chamorros
Liberians
9.0%
UNEMPLOYMENT AMONG SENIORS OVER 75 YEARS
7.7/ 100
METRIC RATING
221st/ 347
METRIC RANK
10.2%
UNEMPLOYMENT AMONG SENIORS OVER 75 YEARS
0.0/ 100
METRIC RATING
318th/ 347
METRIC RANK
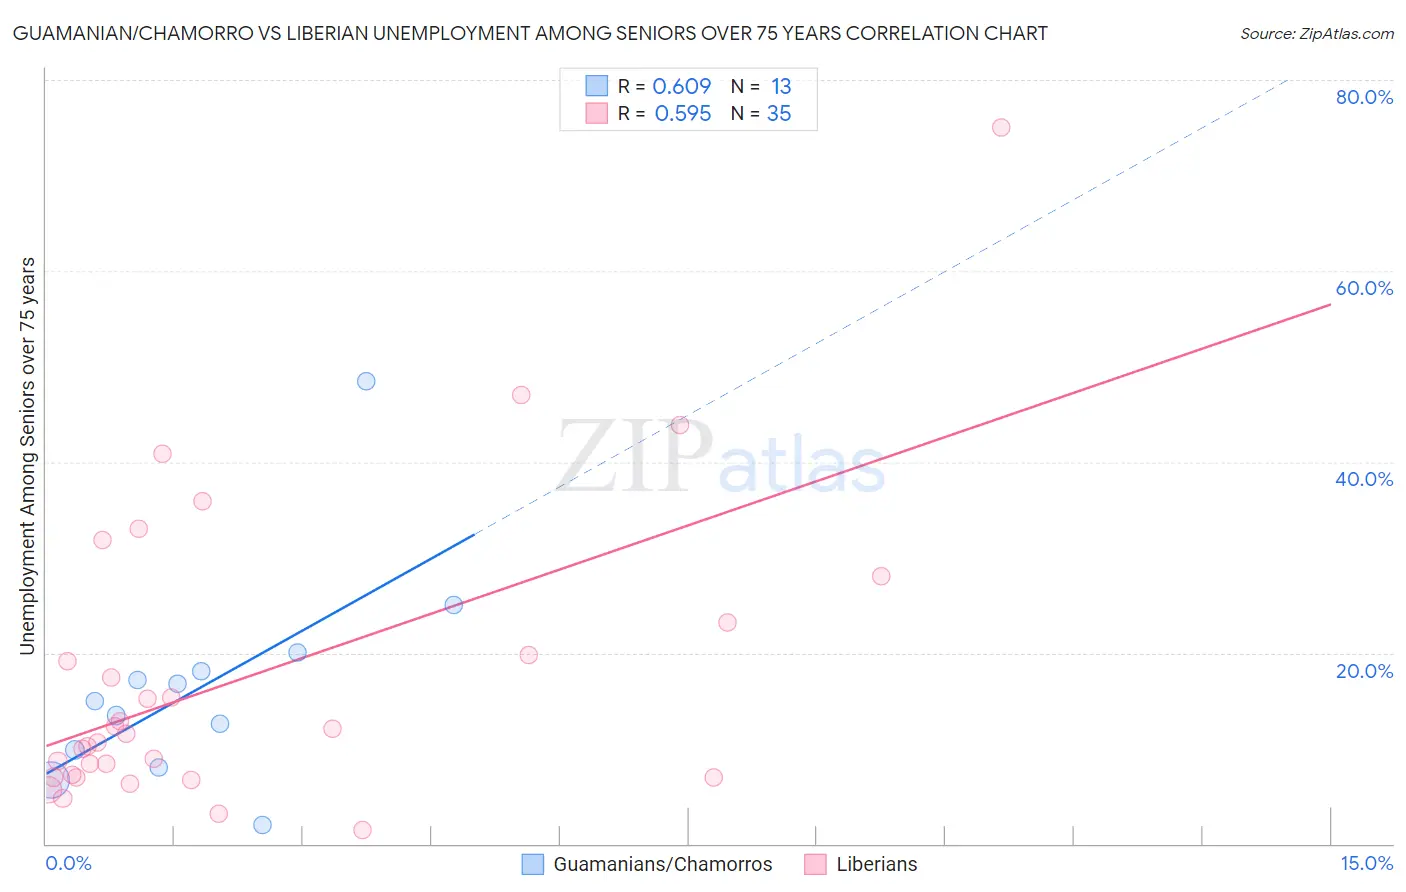
Guamanian/Chamorro vs Liberian Unemployment Among Seniors over 75 years Correlation Chart
The statistical analysis conducted on geographies consisting of 136,667,243 people shows a significant positive correlation between the proportion of Guamanians/Chamorros and unemployment rate among seniors over the age of 75 in the United States with a correlation coefficient (R) of 0.609 and weighted average of 9.0%. Similarly, the statistical analysis conducted on geographies consisting of 84,949,227 people shows a substantial positive correlation between the proportion of Liberians and unemployment rate among seniors over the age of 75 in the United States with a correlation coefficient (R) of 0.595 and weighted average of 10.2%, a difference of 13.4%.
Unemployment Among Seniors over 75 years Correlation Summary
| Measurement | Guamanian/Chamorro | Liberian |
| Minimum | 2.0% | 1.4% |
| Maximum | 48.4% | 75.0% |
| Range | 46.4% | 73.6% |
| Mean | 16.4% | 17.6% |
| Median | 14.9% | 11.5% |
| Interquartile 25% (IQ1) | 8.9% | 7.0% |
| Interquartile 75% (IQ3) | 19.0% | 23.2% |
| Interquartile Range (IQR) | 10.1% | 16.2% |
| Standard Deviation (Sample) | 11.4% | 15.7% |
| Standard Deviation (Population) | 10.9% | 15.5% |
Similar Demographics by Unemployment Among Seniors over 75 years
Demographics Similar to Guamanians/Chamorros by Unemployment Among Seniors over 75 years
In terms of unemployment among seniors over 75 years, the demographic groups most similar to Guamanians/Chamorros are Immigrants from Zimbabwe (9.0%, a difference of 0.020%), Peruvian (9.0%, a difference of 0.070%), Afghan (9.0%, a difference of 0.10%), Immigrants from Jordan (9.0%, a difference of 0.14%), and Costa Rican (9.1%, a difference of 0.27%).
| Demographics | Rating | Rank | Unemployment Among Seniors over 75 years |
| Immigrants | Brazil | 13.3 /100 | #214 | Poor 9.0% |
| Immigrants | Western Asia | 12.5 /100 | #215 | Poor 9.0% |
| Immigrants | Oceania | 11.8 /100 | #216 | Poor 9.0% |
| Lebanese | 11.1 /100 | #217 | Poor 9.0% |
| Immigrants | Africa | 9.7 /100 | #218 | Tragic 9.0% |
| Afghans | 8.3 /100 | #219 | Tragic 9.0% |
| Immigrants | Zimbabwe | 7.8 /100 | #220 | Tragic 9.0% |
| Guamanians/Chamorros | 7.7 /100 | #221 | Tragic 9.0% |
| Peruvians | 7.3 /100 | #222 | Tragic 9.0% |
| Immigrants | Jordan | 6.9 /100 | #223 | Tragic 9.0% |
| Costa Ricans | 6.3 /100 | #224 | Tragic 9.1% |
| Navajo | 6.1 /100 | #225 | Tragic 9.1% |
| Immigrants | Bangladesh | 5.9 /100 | #226 | Tragic 9.1% |
| Samoans | 5.7 /100 | #227 | Tragic 9.1% |
| Kenyans | 5.4 /100 | #228 | Tragic 9.1% |
Demographics Similar to Liberians by Unemployment Among Seniors over 75 years
In terms of unemployment among seniors over 75 years, the demographic groups most similar to Liberians are German (10.3%, a difference of 0.070%), Irish (10.2%, a difference of 0.12%), French (10.3%, a difference of 0.29%), Aleut (10.3%, a difference of 0.31%), and Native/Alaskan (10.2%, a difference of 0.49%).
| Demographics | Rating | Rank | Unemployment Among Seniors over 75 years |
| Scottish | 0.0 /100 | #311 | Tragic 10.1% |
| Chippewa | 0.0 /100 | #312 | Tragic 10.1% |
| Nepalese | 0.0 /100 | #313 | Tragic 10.1% |
| Dutch West Indians | 0.0 /100 | #314 | Tragic 10.2% |
| Pennsylvania Germans | 0.0 /100 | #315 | Tragic 10.2% |
| Natives/Alaskans | 0.0 /100 | #316 | Tragic 10.2% |
| Irish | 0.0 /100 | #317 | Tragic 10.2% |
| Liberians | 0.0 /100 | #318 | Tragic 10.2% |
| Germans | 0.0 /100 | #319 | Tragic 10.3% |
| French | 0.0 /100 | #320 | Tragic 10.3% |
| Aleuts | 0.0 /100 | #321 | Tragic 10.3% |
| Poles | 0.0 /100 | #322 | Tragic 10.3% |
| Tongans | 0.0 /100 | #323 | Tragic 10.4% |
| Americans | 0.0 /100 | #324 | Tragic 10.4% |
| Portuguese | 0.0 /100 | #325 | Tragic 10.4% |