Immigrants from El Salvador vs Liberian No Vehicles in Household
COMPARE
Immigrants from El Salvador
Liberian
No Vehicles in Household
No Vehicles in Household Comparison
Immigrants from El Salvador
Liberians
10.4%
NO VEHICLES IN HOUSEHOLD
49.1/ 100
METRIC RATING
177th/ 347
METRIC RANK
12.0%
NO VEHICLES IN HOUSEHOLD
1.2/ 100
METRIC RATING
256th/ 347
METRIC RANK
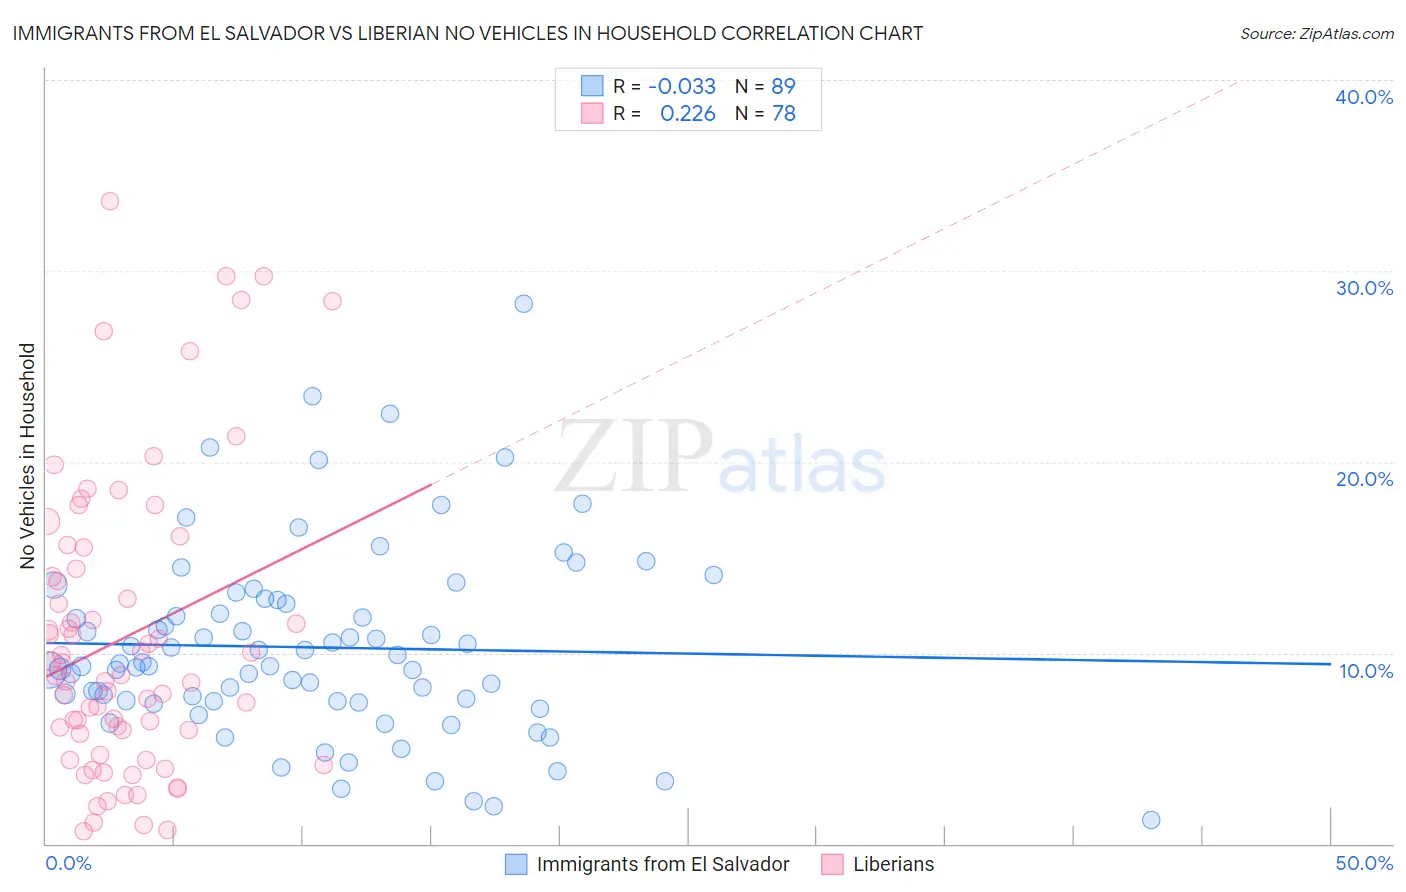
Immigrants from El Salvador vs Liberian No Vehicles in Household Correlation Chart
The statistical analysis conducted on geographies consisting of 357,255,745 people shows no correlation between the proportion of Immigrants from El Salvador and percentage of households with no vehicle available in the United States with a correlation coefficient (R) of -0.033 and weighted average of 10.4%. Similarly, the statistical analysis conducted on geographies consisting of 118,010,925 people shows a weak positive correlation between the proportion of Liberians and percentage of households with no vehicle available in the United States with a correlation coefficient (R) of 0.226 and weighted average of 12.0%, a difference of 14.9%.
No Vehicles in Household Correlation Summary
| Measurement | Immigrants from El Salvador | Liberian |
| Minimum | 1.3% | 0.64% |
| Maximum | 28.3% | 33.6% |
| Range | 27.0% | 33.0% |
| Mean | 10.3% | 10.8% |
| Median | 9.3% | 8.8% |
| Interquartile 25% (IQ1) | 7.4% | 5.7% |
| Interquartile 75% (IQ3) | 12.7% | 14.4% |
| Interquartile Range (IQR) | 5.2% | 8.7% |
| Standard Deviation (Sample) | 4.9% | 7.7% |
| Standard Deviation (Population) | 4.9% | 7.6% |
Similar Demographics by No Vehicles in Household
Demographics Similar to Immigrants from El Salvador by No Vehicles in Household
In terms of no vehicles in household, the demographic groups most similar to Immigrants from El Salvador are Immigrants from Burma/Myanmar (10.4%, a difference of 0.010%), French American Indian (10.4%, a difference of 0.010%), Immigrants from Sudan (10.4%, a difference of 0.13%), Filipino (10.4%, a difference of 0.14%), and Immigrants from Ethiopia (10.4%, a difference of 0.15%).
| Demographics | Rating | Rank | No Vehicles in Household |
| Immigrants | Latin America | 53.2 /100 | #170 | Average 10.4% |
| Hmong | 52.7 /100 | #171 | Average 10.4% |
| Brazilians | 51.7 /100 | #172 | Average 10.4% |
| Filipinos | 50.1 /100 | #173 | Average 10.4% |
| Immigrants | Sudan | 50.0 /100 | #174 | Average 10.4% |
| Immigrants | Burma/Myanmar | 49.1 /100 | #175 | Average 10.4% |
| French American Indians | 49.1 /100 | #176 | Average 10.4% |
| Immigrants | El Salvador | 49.1 /100 | #177 | Average 10.4% |
| Immigrants | Ethiopia | 48.0 /100 | #178 | Average 10.4% |
| Ethiopians | 45.8 /100 | #179 | Average 10.5% |
| Arabs | 45.3 /100 | #180 | Average 10.5% |
| Immigrants | Colombia | 44.1 /100 | #181 | Average 10.5% |
| Immigrants | Bulgaria | 43.8 /100 | #182 | Average 10.5% |
| Natives/Alaskans | 43.7 /100 | #183 | Average 10.5% |
| Immigrants | Nepal | 42.4 /100 | #184 | Average 10.5% |
Demographics Similar to Liberians by No Vehicles in Household
In terms of no vehicles in household, the demographic groups most similar to Liberians are Honduran (12.0%, a difference of 0.050%), Immigrants from Uruguay (11.9%, a difference of 0.32%), Egyptian (11.9%, a difference of 0.64%), Immigrants from Serbia (11.9%, a difference of 0.71%), and Nigerian (12.1%, a difference of 0.74%).
| Demographics | Rating | Rank | No Vehicles in Household |
| Immigrants | Nigeria | 1.9 /100 | #249 | Tragic 11.8% |
| Paiute | 1.8 /100 | #250 | Tragic 11.8% |
| Blacks/African Americans | 1.6 /100 | #251 | Tragic 11.9% |
| Immigrants | Serbia | 1.5 /100 | #252 | Tragic 11.9% |
| Egyptians | 1.4 /100 | #253 | Tragic 11.9% |
| Immigrants | Uruguay | 1.3 /100 | #254 | Tragic 11.9% |
| Hondurans | 1.2 /100 | #255 | Tragic 12.0% |
| Liberians | 1.2 /100 | #256 | Tragic 12.0% |
| Nigerians | 0.9 /100 | #257 | Tragic 12.1% |
| South American Indians | 0.9 /100 | #258 | Tragic 12.1% |
| Immigrants | Latvia | 0.8 /100 | #259 | Tragic 12.1% |
| Macedonians | 0.7 /100 | #260 | Tragic 12.2% |
| Sub-Saharan Africans | 0.6 /100 | #261 | Tragic 12.2% |
| Immigrants | Liberia | 0.6 /100 | #262 | Tragic 12.2% |
| Immigrants | Egypt | 0.6 /100 | #263 | Tragic 12.2% |