Guamanian/Chamorro vs Icelander 3 or more Vehicles in Household
COMPARE
Guamanian/Chamorro
Icelander
3 or more Vehicles in Household
3 or more Vehicles in Household Comparison
Guamanians/Chamorros
Icelanders
23.2%
3 OR MORE VEHICLES IN HOUSEHOLD
100.0/ 100
METRIC RATING
27th/ 347
METRIC RANK
21.5%
3 OR MORE VEHICLES IN HOUSEHOLD
99.6/ 100
METRIC RATING
84th/ 347
METRIC RANK
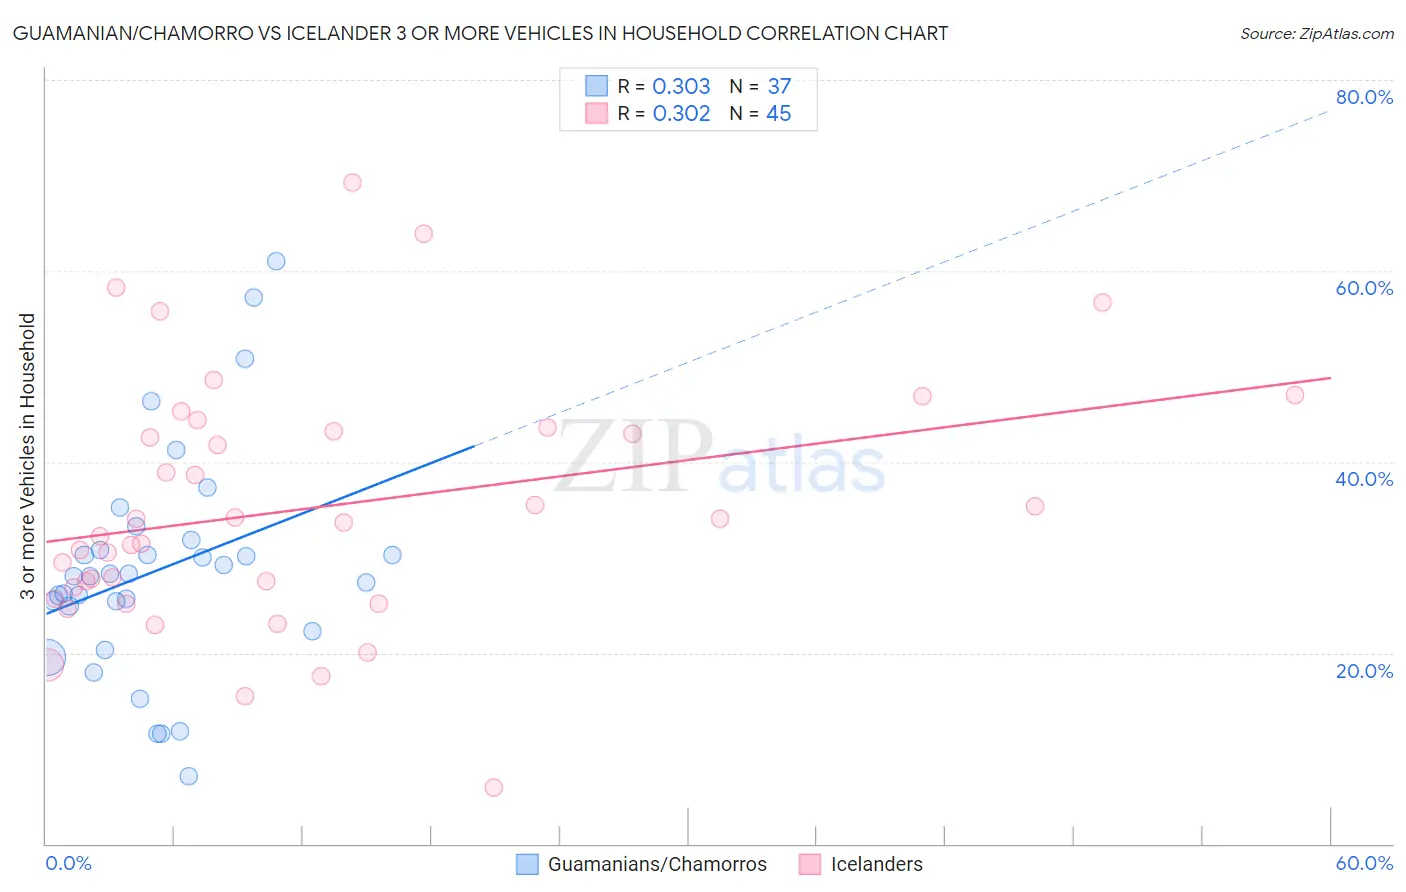
Guamanian/Chamorro vs Icelander 3 or more Vehicles in Household Correlation Chart
The statistical analysis conducted on geographies consisting of 221,863,982 people shows a mild positive correlation between the proportion of Guamanians/Chamorros and percentage of households with 3 or more vehicles available in the United States with a correlation coefficient (R) of 0.303 and weighted average of 23.2%. Similarly, the statistical analysis conducted on geographies consisting of 159,607,768 people shows a mild positive correlation between the proportion of Icelanders and percentage of households with 3 or more vehicles available in the United States with a correlation coefficient (R) of 0.302 and weighted average of 21.5%, a difference of 8.0%.
3 or more Vehicles in Household Correlation Summary
| Measurement | Guamanian/Chamorro | Icelander |
| Minimum | 7.1% | 5.9% |
| Maximum | 61.0% | 69.2% |
| Range | 53.9% | 63.3% |
| Mean | 28.7% | 35.2% |
| Median | 28.0% | 33.7% |
| Interquartile 25% (IQ1) | 23.6% | 26.2% |
| Interquartile 75% (IQ3) | 31.3% | 43.5% |
| Interquartile Range (IQR) | 7.8% | 17.2% |
| Standard Deviation (Sample) | 11.6% | 13.1% |
| Standard Deviation (Population) | 11.5% | 12.9% |
Similar Demographics by 3 or more Vehicles in Household
Demographics Similar to Guamanians/Chamorros by 3 or more Vehicles in Household
In terms of 3 or more vehicles in household, the demographic groups most similar to Guamanians/Chamorros are Mexican American Indian (23.3%, a difference of 0.13%), Lumbee (23.1%, a difference of 0.33%), Spanish (23.1%, a difference of 0.40%), Immigrants from South Eastern Asia (23.1%, a difference of 0.57%), and English (23.1%, a difference of 0.76%).
| Demographics | Rating | Rank | 3 or more Vehicles in Household |
| Paiute | 100.0 /100 | #20 | Exceptional 23.8% |
| Immigrants | Vietnam | 100.0 /100 | #21 | Exceptional 23.8% |
| Immigrants | Philippines | 100.0 /100 | #22 | Exceptional 23.8% |
| Scandinavians | 100.0 /100 | #23 | Exceptional 23.6% |
| Sri Lankans | 100.0 /100 | #24 | Exceptional 23.6% |
| Immigrants | Central America | 100.0 /100 | #25 | Exceptional 23.4% |
| Mexican American Indians | 100.0 /100 | #26 | Exceptional 23.3% |
| Guamanians/Chamorros | 100.0 /100 | #27 | Exceptional 23.2% |
| Lumbee | 100.0 /100 | #28 | Exceptional 23.1% |
| Spanish | 100.0 /100 | #29 | Exceptional 23.1% |
| Immigrants | South Eastern Asia | 100.0 /100 | #30 | Exceptional 23.1% |
| English | 100.0 /100 | #31 | Exceptional 23.1% |
| Pueblo | 100.0 /100 | #32 | Exceptional 23.0% |
| Spanish Americans | 100.0 /100 | #33 | Exceptional 23.0% |
| Swiss | 100.0 /100 | #34 | Exceptional 23.0% |
Demographics Similar to Icelanders by 3 or more Vehicles in Household
In terms of 3 or more vehicles in household, the demographic groups most similar to Icelanders are Laotian (21.5%, a difference of 0.010%), Chippewa (21.5%, a difference of 0.050%), Immigrants from El Salvador (21.5%, a difference of 0.080%), Delaware (21.5%, a difference of 0.090%), and Immigrants from the Azores (21.5%, a difference of 0.21%).
| Demographics | Rating | Rank | 3 or more Vehicles in Household |
| Irish | 99.8 /100 | #77 | Exceptional 21.8% |
| Czechoslovakians | 99.8 /100 | #78 | Exceptional 21.7% |
| Assyrians/Chaldeans/Syriacs | 99.8 /100 | #79 | Exceptional 21.7% |
| Afghans | 99.7 /100 | #80 | Exceptional 21.7% |
| Celtics | 99.7 /100 | #81 | Exceptional 21.7% |
| Immigrants | El Salvador | 99.6 /100 | #82 | Exceptional 21.5% |
| Chippewa | 99.6 /100 | #83 | Exceptional 21.5% |
| Icelanders | 99.6 /100 | #84 | Exceptional 21.5% |
| Laotians | 99.6 /100 | #85 | Exceptional 21.5% |
| Delaware | 99.6 /100 | #86 | Exceptional 21.5% |
| Immigrants | Azores | 99.5 /100 | #87 | Exceptional 21.5% |
| French | 99.4 /100 | #88 | Exceptional 21.4% |
| Marshallese | 99.2 /100 | #89 | Exceptional 21.3% |
| Immigrants | Afghanistan | 99.1 /100 | #90 | Exceptional 21.2% |
| Belgians | 98.9 /100 | #91 | Exceptional 21.2% |