Guamanian/Chamorro vs Danish 3 or more Vehicles in Household
COMPARE
Guamanian/Chamorro
Danish
3 or more Vehicles in Household
3 or more Vehicles in Household Comparison
Guamanians/Chamorros
Danes
23.2%
3 OR MORE VEHICLES IN HOUSEHOLD
100.0/ 100
METRIC RATING
27th/ 347
METRIC RANK
24.7%
3 OR MORE VEHICLES IN HOUSEHOLD
100.0/ 100
METRIC RATING
12th/ 347
METRIC RANK
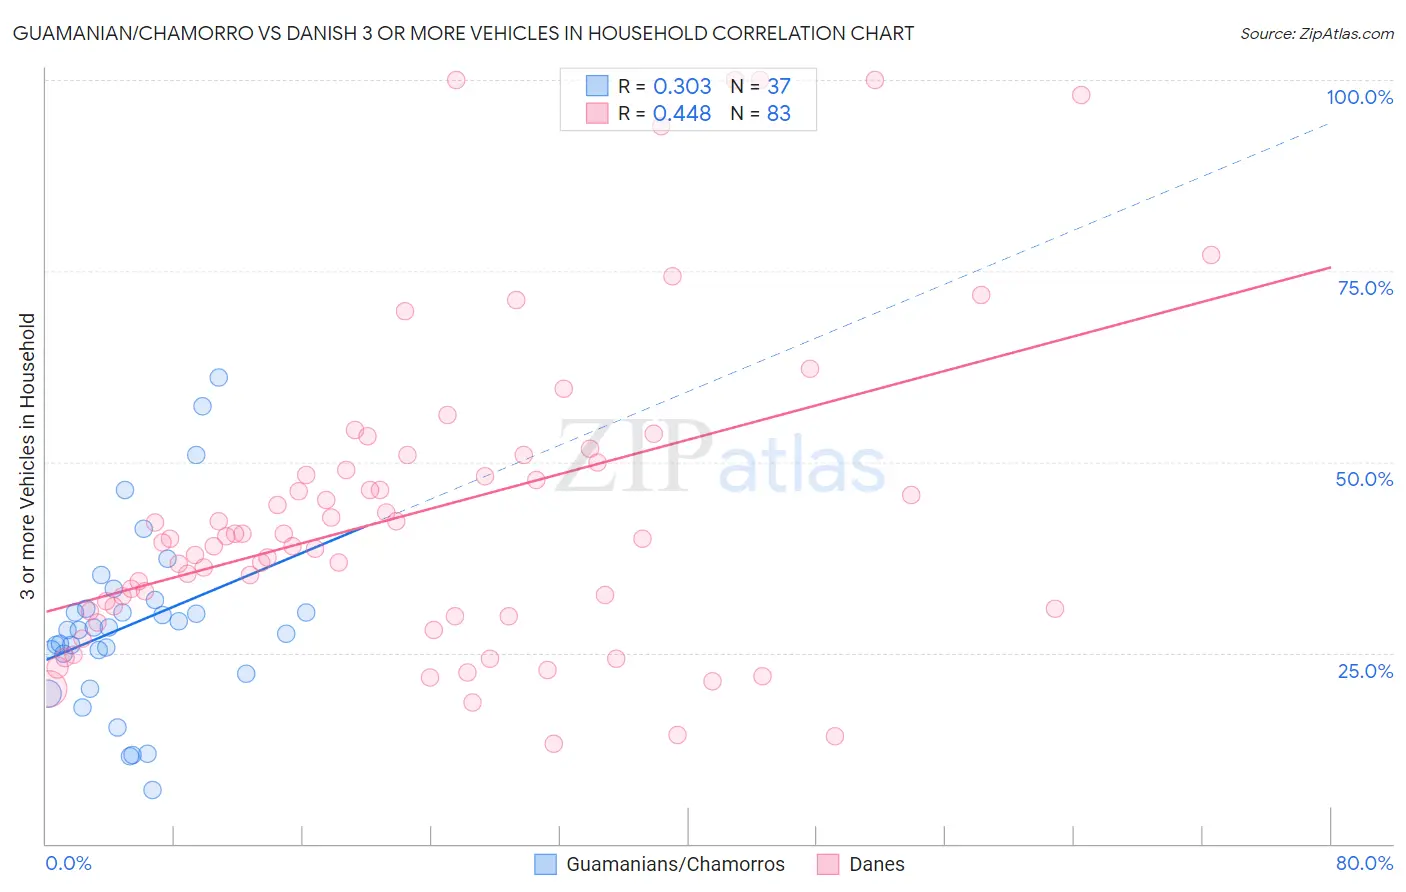
Guamanian/Chamorro vs Danish 3 or more Vehicles in Household Correlation Chart
The statistical analysis conducted on geographies consisting of 221,863,982 people shows a mild positive correlation between the proportion of Guamanians/Chamorros and percentage of households with 3 or more vehicles available in the United States with a correlation coefficient (R) of 0.303 and weighted average of 23.2%. Similarly, the statistical analysis conducted on geographies consisting of 473,746,883 people shows a moderate positive correlation between the proportion of Danes and percentage of households with 3 or more vehicles available in the United States with a correlation coefficient (R) of 0.448 and weighted average of 24.7%, a difference of 6.4%.
3 or more Vehicles in Household Correlation Summary
| Measurement | Guamanian/Chamorro | Danish |
| Minimum | 7.1% | 13.0% |
| Maximum | 61.0% | 100.0% |
| Range | 53.9% | 87.0% |
| Mean | 28.7% | 43.5% |
| Median | 28.0% | 40.0% |
| Interquartile 25% (IQ1) | 23.6% | 30.5% |
| Interquartile 75% (IQ3) | 31.3% | 50.0% |
| Interquartile Range (IQR) | 7.8% | 19.5% |
| Standard Deviation (Sample) | 11.6% | 20.6% |
| Standard Deviation (Population) | 11.5% | 20.5% |
Demographics Similar to Guamanians/Chamorros and Danes by 3 or more Vehicles in Household
In terms of 3 or more vehicles in household, the demographic groups most similar to Guamanians/Chamorros are Mexican American Indian (23.3%, a difference of 0.13%), Lumbee (23.1%, a difference of 0.33%), Spanish (23.1%, a difference of 0.40%), Immigrants from Central America (23.4%, a difference of 0.91%), and Sri Lankan (23.6%, a difference of 1.4%). Similarly, the demographic groups most similar to Danes are Mexican (24.7%, a difference of 0.080%), Immigrants from Mexico (24.6%, a difference of 0.52%), Shoshone (24.9%, a difference of 0.69%), Nepalese (24.9%, a difference of 0.79%), and Native Hawaiian (24.9%, a difference of 0.88%).
| Demographics | Rating | Rank | 3 or more Vehicles in Household |
| Native Hawaiians | 100.0 /100 | #9 | Exceptional 24.9% |
| Nepalese | 100.0 /100 | #10 | Exceptional 24.9% |
| Shoshone | 100.0 /100 | #11 | Exceptional 24.9% |
| Danes | 100.0 /100 | #12 | Exceptional 24.7% |
| Mexicans | 100.0 /100 | #13 | Exceptional 24.7% |
| Immigrants | Mexico | 100.0 /100 | #14 | Exceptional 24.6% |
| Hawaiians | 100.0 /100 | #15 | Exceptional 24.3% |
| Basques | 100.0 /100 | #16 | Exceptional 24.3% |
| Koreans | 100.0 /100 | #17 | Exceptional 24.1% |
| Norwegians | 100.0 /100 | #18 | Exceptional 23.9% |
| Chinese | 100.0 /100 | #19 | Exceptional 23.9% |
| Paiute | 100.0 /100 | #20 | Exceptional 23.8% |
| Immigrants | Vietnam | 100.0 /100 | #21 | Exceptional 23.8% |
| Immigrants | Philippines | 100.0 /100 | #22 | Exceptional 23.8% |
| Scandinavians | 100.0 /100 | #23 | Exceptional 23.6% |
| Sri Lankans | 100.0 /100 | #24 | Exceptional 23.6% |
| Immigrants | Central America | 100.0 /100 | #25 | Exceptional 23.4% |
| Mexican American Indians | 100.0 /100 | #26 | Exceptional 23.3% |
| Guamanians/Chamorros | 100.0 /100 | #27 | Exceptional 23.2% |
| Lumbee | 100.0 /100 | #28 | Exceptional 23.1% |
| Spanish | 100.0 /100 | #29 | Exceptional 23.1% |