Guamanian/Chamorro vs Icelander Female Poverty Among 25-34 Year Olds
COMPARE
Guamanian/Chamorro
Icelander
Female Poverty Among 25-34 Year Olds
Female Poverty Among 25-34 Year Olds Comparison
Guamanians/Chamorros
Icelanders
13.6%
FEMALE POVERTY AMONG 25-34 YEAR OLDS
41.5/ 100
METRIC RATING
181st/ 347
METRIC RANK
13.3%
FEMALE POVERTY AMONG 25-34 YEAR OLDS
65.7/ 100
METRIC RATING
161st/ 347
METRIC RANK
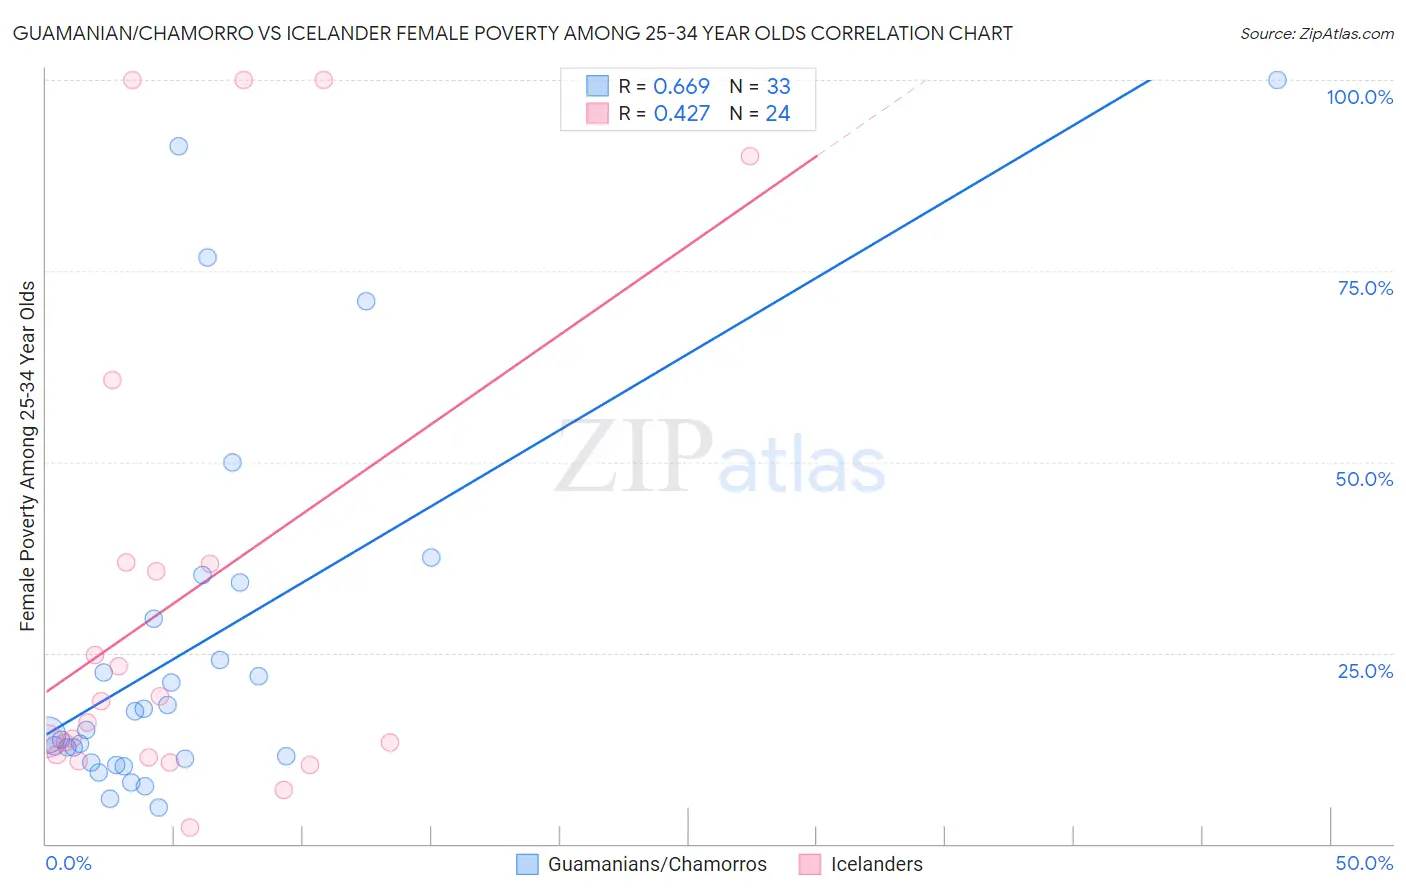
Guamanian/Chamorro vs Icelander Female Poverty Among 25-34 Year Olds Correlation Chart
The statistical analysis conducted on geographies consisting of 220,375,299 people shows a significant positive correlation between the proportion of Guamanians/Chamorros and poverty level among females between the ages 25 and 34 in the United States with a correlation coefficient (R) of 0.669 and weighted average of 13.6%. Similarly, the statistical analysis conducted on geographies consisting of 158,293,489 people shows a moderate positive correlation between the proportion of Icelanders and poverty level among females between the ages 25 and 34 in the United States with a correlation coefficient (R) of 0.427 and weighted average of 13.3%, a difference of 2.1%.
Female Poverty Among 25-34 Year Olds Correlation Summary
| Measurement | Guamanian/Chamorro | Icelander |
| Minimum | 4.8% | 2.1% |
| Maximum | 100.0% | 100.0% |
| Range | 95.2% | 97.9% |
| Mean | 25.8% | 32.5% |
| Median | 14.8% | 17.3% |
| Interquartile 25% (IQ1) | 10.9% | 11.4% |
| Interquartile 75% (IQ3) | 31.8% | 36.8% |
| Interquartile Range (IQR) | 20.9% | 25.4% |
| Standard Deviation (Sample) | 24.7% | 32.3% |
| Standard Deviation (Population) | 24.3% | 31.6% |
Demographics Similar to Guamanians/Chamorros and Icelanders by Female Poverty Among 25-34 Year Olds
In terms of female poverty among 25-34 year olds, the demographic groups most similar to Guamanians/Chamorros are German (13.6%, a difference of 0.010%), Immigrants from Eastern Africa (13.6%, a difference of 0.17%), Canadian (13.6%, a difference of 0.24%), Venezuelan (13.6%, a difference of 0.27%), and Yugoslavian (13.6%, a difference of 0.30%). Similarly, the demographic groups most similar to Icelanders are Ugandan (13.4%, a difference of 0.15%), British (13.4%, a difference of 0.20%), Swiss (13.4%, a difference of 0.36%), Basque (13.4%, a difference of 0.57%), and Belgian (13.4%, a difference of 0.61%).
| Demographics | Rating | Rank | Female Poverty Among 25-34 Year Olds |
| Icelanders | 65.7 /100 | #161 | Good 13.3% |
| Ugandans | 64.1 /100 | #162 | Good 13.4% |
| British | 63.5 /100 | #163 | Good 13.4% |
| Swiss | 61.7 /100 | #164 | Good 13.4% |
| Basques | 59.3 /100 | #165 | Average 13.4% |
| Belgians | 58.9 /100 | #166 | Average 13.4% |
| Immigrants | Bosnia and Herzegovina | 58.6 /100 | #167 | Average 13.4% |
| Immigrants | Afghanistan | 57.7 /100 | #168 | Average 13.4% |
| Samoans | 56.8 /100 | #169 | Average 13.5% |
| Immigrants | Uganda | 53.0 /100 | #170 | Average 13.5% |
| South American Indians | 51.9 /100 | #171 | Average 13.5% |
| Immigrants | Costa Rica | 51.9 /100 | #172 | Average 13.5% |
| Kenyans | 51.8 /100 | #173 | Average 13.5% |
| Immigrants | Oceania | 50.0 /100 | #174 | Average 13.5% |
| Bermudans | 46.8 /100 | #175 | Average 13.6% |
| Yugoslavians | 45.0 /100 | #176 | Average 13.6% |
| Venezuelans | 44.6 /100 | #177 | Average 13.6% |
| Canadians | 44.3 /100 | #178 | Average 13.6% |
| Immigrants | Eastern Africa | 43.6 /100 | #179 | Average 13.6% |
| Germans | 41.6 /100 | #180 | Average 13.6% |
| Guamanians/Chamorros | 41.5 /100 | #181 | Average 13.6% |