German vs Immigrants from Taiwan 3 or more Vehicles in Household
COMPARE
German
Immigrants from Taiwan
3 or more Vehicles in Household
3 or more Vehicles in Household Comparison
Germans
Immigrants from Taiwan
22.7%
3 OR MORE VEHICLES IN HOUSEHOLD
100.0/ 100
METRIC RATING
41st/ 347
METRIC RANK
22.1%
3 OR MORE VEHICLES IN HOUSEHOLD
99.9/ 100
METRIC RATING
64th/ 347
METRIC RANK
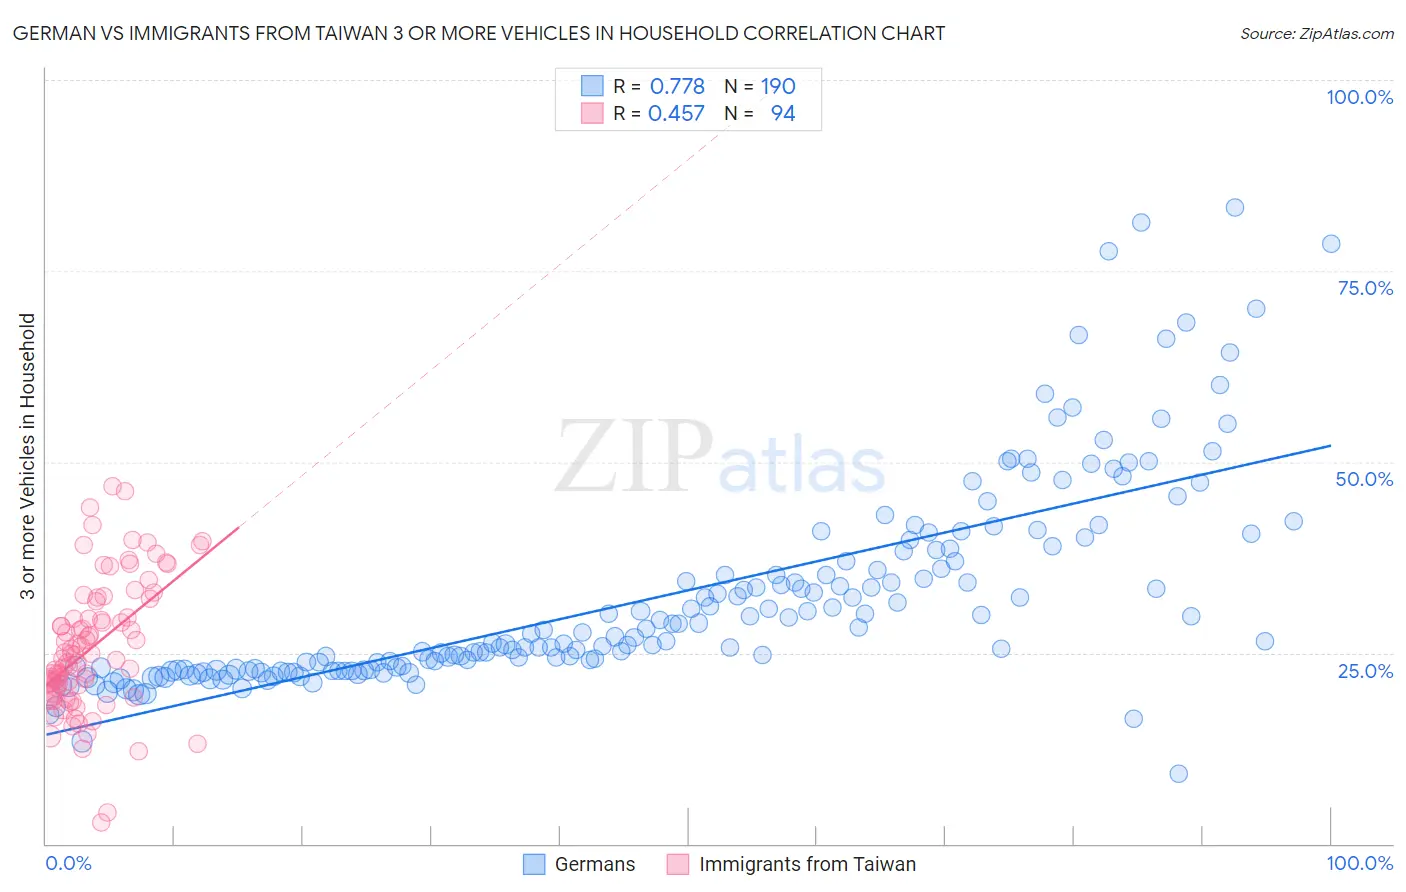
German vs Immigrants from Taiwan 3 or more Vehicles in Household Correlation Chart
The statistical analysis conducted on geographies consisting of 580,173,272 people shows a strong positive correlation between the proportion of Germans and percentage of households with 3 or more vehicles available in the United States with a correlation coefficient (R) of 0.778 and weighted average of 22.7%. Similarly, the statistical analysis conducted on geographies consisting of 298,037,283 people shows a moderate positive correlation between the proportion of Immigrants from Taiwan and percentage of households with 3 or more vehicles available in the United States with a correlation coefficient (R) of 0.457 and weighted average of 22.1%, a difference of 2.8%.
3 or more Vehicles in Household Correlation Summary
| Measurement | German | Immigrants from Taiwan |
| Minimum | 9.2% | 2.7% |
| Maximum | 83.3% | 46.8% |
| Range | 74.1% | 44.0% |
| Mean | 32.3% | 25.8% |
| Median | 27.1% | 24.8% |
| Interquartile 25% (IQ1) | 22.8% | 20.1% |
| Interquartile 75% (IQ3) | 37.0% | 31.7% |
| Interquartile Range (IQR) | 14.2% | 11.6% |
| Standard Deviation (Sample) | 13.4% | 8.6% |
| Standard Deviation (Population) | 13.4% | 8.6% |
Similar Demographics by 3 or more Vehicles in Household
Demographics Similar to Germans by 3 or more Vehicles in Household
In terms of 3 or more vehicles in household, the demographic groups most similar to Germans are Native/Alaskan (22.7%, a difference of 0.0%), Osage (22.7%, a difference of 0.12%), Cheyenne (22.7%, a difference of 0.25%), Ute (22.7%, a difference of 0.35%), and European (22.9%, a difference of 0.47%).
| Demographics | Rating | Rank | 3 or more Vehicles in Household |
| Swiss | 100.0 /100 | #34 | Exceptional 23.0% |
| Choctaw | 100.0 /100 | #35 | Exceptional 23.0% |
| Cherokee | 100.0 /100 | #36 | Exceptional 23.0% |
| Swedes | 100.0 /100 | #37 | Exceptional 23.0% |
| Dutch | 100.0 /100 | #38 | Exceptional 22.9% |
| Yaqui | 100.0 /100 | #39 | Exceptional 22.9% |
| Europeans | 100.0 /100 | #40 | Exceptional 22.9% |
| Germans | 100.0 /100 | #41 | Exceptional 22.7% |
| Natives/Alaskans | 100.0 /100 | #42 | Exceptional 22.7% |
| Osage | 100.0 /100 | #43 | Exceptional 22.7% |
| Cheyenne | 100.0 /100 | #44 | Exceptional 22.7% |
| Ute | 100.0 /100 | #45 | Exceptional 22.7% |
| Americans | 100.0 /100 | #46 | Exceptional 22.6% |
| Malaysians | 100.0 /100 | #47 | Exceptional 22.6% |
| Scottish | 100.0 /100 | #48 | Exceptional 22.6% |
Demographics Similar to Immigrants from Taiwan by 3 or more Vehicles in Household
In terms of 3 or more vehicles in household, the demographic groups most similar to Immigrants from Taiwan are Chickasaw (22.2%, a difference of 0.33%), Pima (22.0%, a difference of 0.42%), Fijian (22.2%, a difference of 0.49%), Bhutanese (22.2%, a difference of 0.54%), and Northern European (22.0%, a difference of 0.56%).
| Demographics | Rating | Rank | 3 or more Vehicles in Household |
| Pennsylvania Germans | 100.0 /100 | #57 | Exceptional 22.3% |
| Spaniards | 100.0 /100 | #58 | Exceptional 22.3% |
| Navajo | 100.0 /100 | #59 | Exceptional 22.3% |
| Finns | 99.9 /100 | #60 | Exceptional 22.3% |
| Bhutanese | 99.9 /100 | #61 | Exceptional 22.2% |
| Fijians | 99.9 /100 | #62 | Exceptional 22.2% |
| Chickasaw | 99.9 /100 | #63 | Exceptional 22.2% |
| Immigrants | Taiwan | 99.9 /100 | #64 | Exceptional 22.1% |
| Pima | 99.9 /100 | #65 | Exceptional 22.0% |
| Northern Europeans | 99.9 /100 | #66 | Exceptional 22.0% |
| Alaskan Athabascans | 99.9 /100 | #67 | Exceptional 21.9% |
| British | 99.9 /100 | #68 | Exceptional 21.9% |
| Creek | 99.9 /100 | #69 | Exceptional 21.9% |
| Bangladeshis | 99.8 /100 | #70 | Exceptional 21.9% |
| Potawatomi | 99.8 /100 | #71 | Exceptional 21.9% |