European vs Subsaharan African 3 or more Vehicles in Household
COMPARE
European
Subsaharan African
3 or more Vehicles in Household
3 or more Vehicles in Household Comparison
Europeans
Sub-Saharan Africans
22.9%
3 OR MORE VEHICLES IN HOUSEHOLD
100.0/ 100
METRIC RATING
40th/ 347
METRIC RANK
17.9%
3 OR MORE VEHICLES IN HOUSEHOLD
1.1/ 100
METRIC RATING
256th/ 347
METRIC RANK
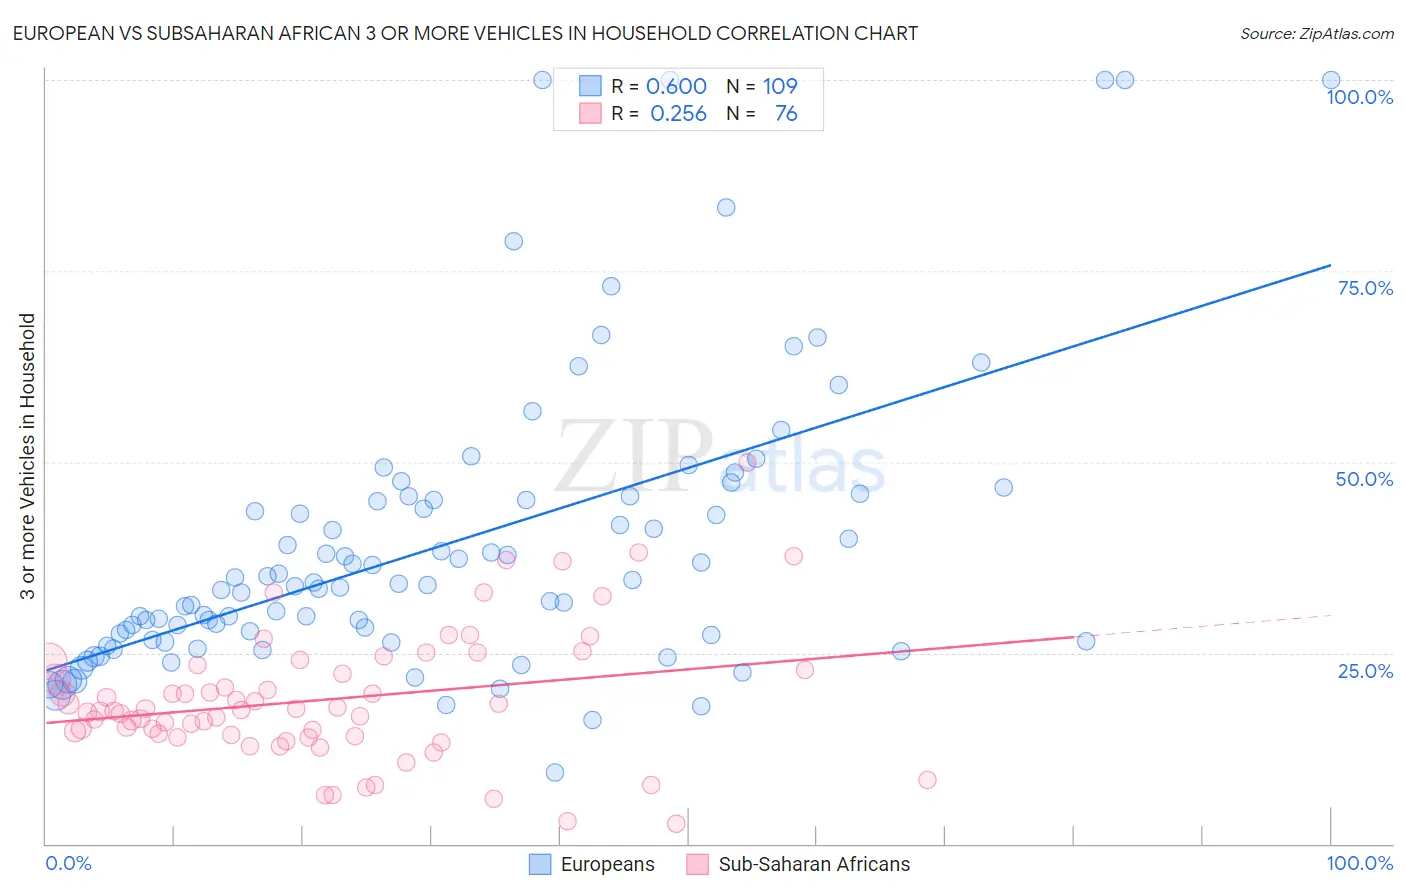
European vs Subsaharan African 3 or more Vehicles in Household Correlation Chart
The statistical analysis conducted on geographies consisting of 560,995,008 people shows a substantial positive correlation between the proportion of Europeans and percentage of households with 3 or more vehicles available in the United States with a correlation coefficient (R) of 0.600 and weighted average of 22.9%. Similarly, the statistical analysis conducted on geographies consisting of 507,393,924 people shows a weak positive correlation between the proportion of Sub-Saharan Africans and percentage of households with 3 or more vehicles available in the United States with a correlation coefficient (R) of 0.256 and weighted average of 17.9%, a difference of 28.0%.
3 or more Vehicles in Household Correlation Summary
| Measurement | European | Subsaharan African |
| Minimum | 9.3% | 2.7% |
| Maximum | 100.0% | 50.0% |
| Range | 90.7% | 47.3% |
| Mean | 39.1% | 18.9% |
| Median | 33.9% | 17.4% |
| Interquartile 25% (IQ1) | 26.6% | 14.2% |
| Interquartile 75% (IQ3) | 45.2% | 23.0% |
| Interquartile Range (IQR) | 18.7% | 8.9% |
| Standard Deviation (Sample) | 19.0% | 8.6% |
| Standard Deviation (Population) | 18.9% | 8.5% |
Similar Demographics by 3 or more Vehicles in Household
Demographics Similar to Europeans by 3 or more Vehicles in Household
In terms of 3 or more vehicles in household, the demographic groups most similar to Europeans are Yaqui (22.9%, a difference of 0.25%), Dutch (22.9%, a difference of 0.35%), German (22.7%, a difference of 0.47%), Native/Alaskan (22.7%, a difference of 0.47%), and Swedish (23.0%, a difference of 0.58%).
| Demographics | Rating | Rank | 3 or more Vehicles in Household |
| Spanish Americans | 100.0 /100 | #33 | Exceptional 23.0% |
| Swiss | 100.0 /100 | #34 | Exceptional 23.0% |
| Choctaw | 100.0 /100 | #35 | Exceptional 23.0% |
| Cherokee | 100.0 /100 | #36 | Exceptional 23.0% |
| Swedes | 100.0 /100 | #37 | Exceptional 23.0% |
| Dutch | 100.0 /100 | #38 | Exceptional 22.9% |
| Yaqui | 100.0 /100 | #39 | Exceptional 22.9% |
| Europeans | 100.0 /100 | #40 | Exceptional 22.9% |
| Germans | 100.0 /100 | #41 | Exceptional 22.7% |
| Natives/Alaskans | 100.0 /100 | #42 | Exceptional 22.7% |
| Osage | 100.0 /100 | #43 | Exceptional 22.7% |
| Cheyenne | 100.0 /100 | #44 | Exceptional 22.7% |
| Ute | 100.0 /100 | #45 | Exceptional 22.7% |
| Americans | 100.0 /100 | #46 | Exceptional 22.6% |
| Malaysians | 100.0 /100 | #47 | Exceptional 22.6% |
Demographics Similar to Sub-Saharan Africans by 3 or more Vehicles in Household
In terms of 3 or more vehicles in household, the demographic groups most similar to Sub-Saharan Africans are Immigrants from Eritrea (17.8%, a difference of 0.050%), Sudanese (17.8%, a difference of 0.050%), Immigrants from Turkey (17.9%, a difference of 0.15%), Ethiopian (17.9%, a difference of 0.18%), and Immigrants from Ethiopia (17.9%, a difference of 0.19%).
| Demographics | Rating | Rank | 3 or more Vehicles in Household |
| Immigrants | Saudi Arabia | 1.7 /100 | #249 | Tragic 18.0% |
| Venezuelans | 1.7 /100 | #250 | Tragic 18.0% |
| Alsatians | 1.5 /100 | #251 | Tragic 18.0% |
| Immigrants | Southern Europe | 1.4 /100 | #252 | Tragic 17.9% |
| Immigrants | Ethiopia | 1.3 /100 | #253 | Tragic 17.9% |
| Ethiopians | 1.2 /100 | #254 | Tragic 17.9% |
| Immigrants | Turkey | 1.2 /100 | #255 | Tragic 17.9% |
| Sub-Saharan Africans | 1.1 /100 | #256 | Tragic 17.9% |
| Immigrants | Eritrea | 1.1 /100 | #257 | Tragic 17.8% |
| Sudanese | 1.1 /100 | #258 | Tragic 17.8% |
| Uruguayans | 1.0 /100 | #259 | Tragic 17.8% |
| Ugandans | 0.9 /100 | #260 | Tragic 17.8% |
| Immigrants | Northern Africa | 0.9 /100 | #261 | Tragic 17.8% |
| Colombians | 0.9 /100 | #262 | Tragic 17.8% |
| Bermudans | 0.9 /100 | #263 | Tragic 17.8% |