European vs Immigrants from Eastern Asia 11th Grade
COMPARE
European
Immigrants from Eastern Asia
11th Grade
11th Grade Comparison
Europeans
Immigrants from Eastern Asia
94.4%
11TH GRADE
100.0/ 100
METRIC RATING
27th/ 347
METRIC RANK
92.7%
11TH GRADE
72.6/ 100
METRIC RATING
157th/ 347
METRIC RANK
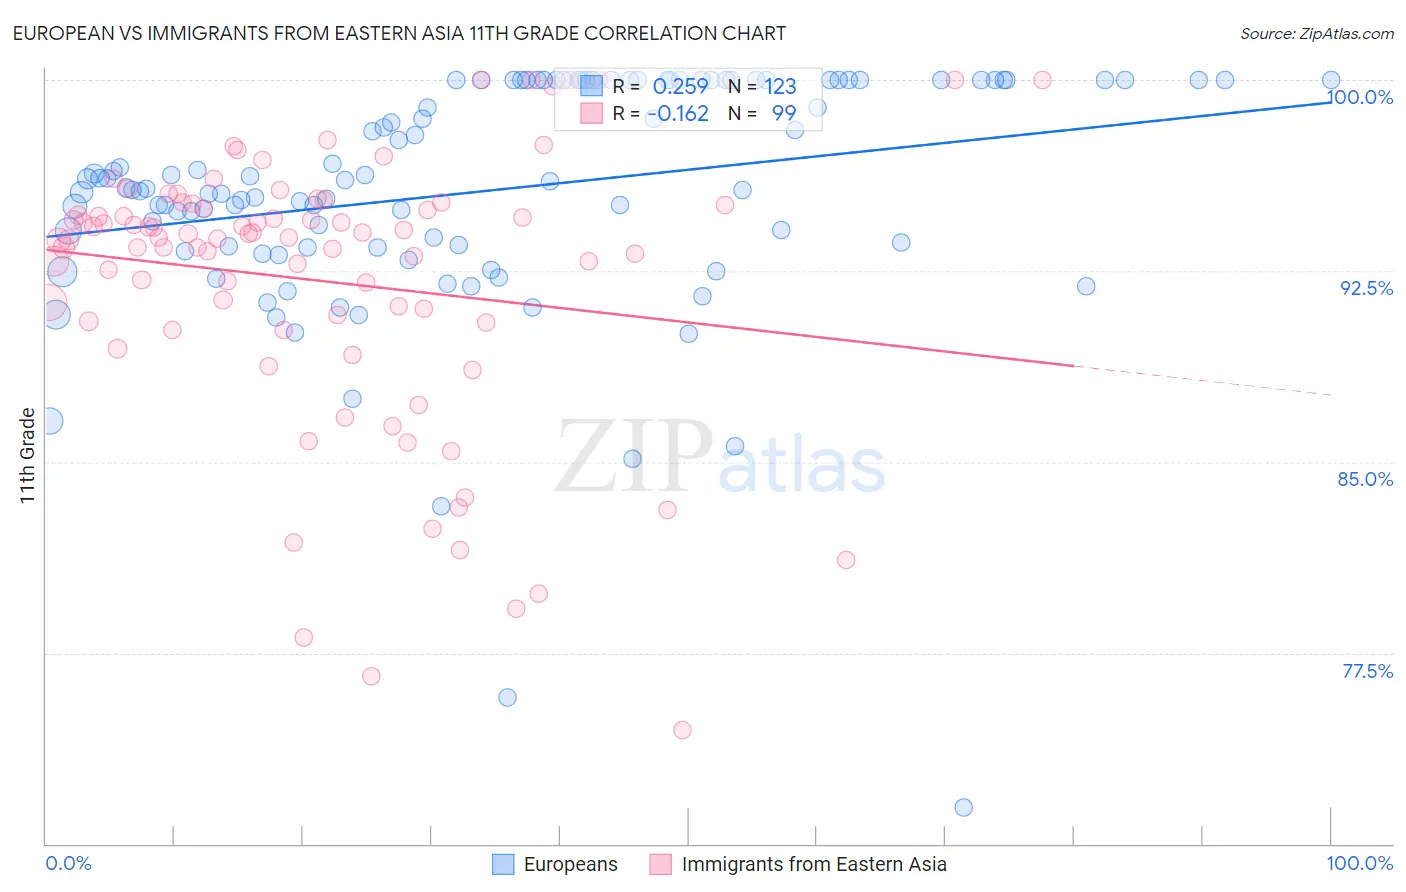
European vs Immigrants from Eastern Asia 11th Grade Correlation Chart
The statistical analysis conducted on geographies consisting of 561,829,322 people shows a weak positive correlation between the proportion of Europeans and percentage of population with at least 11th grade education in the United States with a correlation coefficient (R) of 0.259 and weighted average of 94.4%. Similarly, the statistical analysis conducted on geographies consisting of 499,846,352 people shows a poor negative correlation between the proportion of Immigrants from Eastern Asia and percentage of population with at least 11th grade education in the United States with a correlation coefficient (R) of -0.162 and weighted average of 92.7%, a difference of 1.8%.
11th Grade Correlation Summary
| Measurement | European | Immigrants from Eastern Asia |
| Minimum | 71.4% | 74.5% |
| Maximum | 100.0% | 100.0% |
| Range | 28.6% | 25.5% |
| Mean | 95.6% | 92.1% |
| Median | 96.0% | 93.8% |
| Interquartile 25% (IQ1) | 93.4% | 90.5% |
| Interquartile 75% (IQ3) | 100.0% | 95.1% |
| Interquartile Range (IQR) | 6.6% | 4.6% |
| Standard Deviation (Sample) | 4.7% | 5.4% |
| Standard Deviation (Population) | 4.7% | 5.4% |
Similar Demographics by 11th Grade
Demographics Similar to Europeans by 11th Grade
In terms of 11th grade, the demographic groups most similar to Europeans are Estonian (94.4%, a difference of 0.010%), Irish (94.4%, a difference of 0.020%), Scottish (94.4%, a difference of 0.020%), Dutch (94.3%, a difference of 0.030%), and English (94.4%, a difference of 0.040%).
| Demographics | Rating | Rank | 11th Grade |
| Italians | 100.0 /100 | #20 | Exceptional 94.5% |
| Tlingit-Haida | 100.0 /100 | #21 | Exceptional 94.4% |
| Tsimshian | 100.0 /100 | #22 | Exceptional 94.4% |
| Czechs | 100.0 /100 | #23 | Exceptional 94.4% |
| English | 100.0 /100 | #24 | Exceptional 94.4% |
| Irish | 100.0 /100 | #25 | Exceptional 94.4% |
| Scottish | 100.0 /100 | #26 | Exceptional 94.4% |
| Europeans | 100.0 /100 | #27 | Exceptional 94.4% |
| Estonians | 100.0 /100 | #28 | Exceptional 94.4% |
| Dutch | 100.0 /100 | #29 | Exceptional 94.3% |
| Russians | 100.0 /100 | #30 | Exceptional 94.3% |
| Welsh | 99.9 /100 | #31 | Exceptional 94.2% |
| Belgians | 99.9 /100 | #32 | Exceptional 94.2% |
| British | 99.9 /100 | #33 | Exceptional 94.2% |
| Immigrants | Scotland | 99.9 /100 | #34 | Exceptional 94.2% |
Demographics Similar to Immigrants from Eastern Asia by 11th Grade
In terms of 11th grade, the demographic groups most similar to Immigrants from Eastern Asia are Immigrants from Spain (92.7%, a difference of 0.0%), Osage (92.7%, a difference of 0.010%), Argentinean (92.7%, a difference of 0.010%), Immigrants from Venezuela (92.7%, a difference of 0.010%), and American (92.7%, a difference of 0.010%).
| Demographics | Rating | Rank | 11th Grade |
| Immigrants | Egypt | 77.5 /100 | #150 | Good 92.8% |
| Potawatomi | 74.3 /100 | #151 | Good 92.8% |
| Iraqis | 74.2 /100 | #152 | Good 92.8% |
| Brazilians | 73.9 /100 | #153 | Good 92.8% |
| Osage | 73.4 /100 | #154 | Good 92.7% |
| Argentineans | 73.4 /100 | #155 | Good 92.7% |
| Immigrants | Spain | 73.0 /100 | #156 | Good 92.7% |
| Immigrants | Eastern Asia | 72.6 /100 | #157 | Good 92.7% |
| Immigrants | Venezuela | 72.0 /100 | #158 | Good 92.7% |
| Americans | 71.7 /100 | #159 | Good 92.7% |
| Immigrants | Lebanon | 70.7 /100 | #160 | Good 92.7% |
| Immigrants | Argentina | 69.8 /100 | #161 | Good 92.7% |
| Paraguayans | 68.7 /100 | #162 | Good 92.7% |
| Immigrants | Nonimmigrants | 66.6 /100 | #163 | Good 92.7% |
| Spanish | 66.2 /100 | #164 | Good 92.7% |