Ethiopian vs Cheyenne 2 or more Vehicles in Household
COMPARE
Ethiopian
Cheyenne
2 or more Vehicles in Household
2 or more Vehicles in Household Comparison
Ethiopians
Cheyenne
53.1%
2 OR MORE VEHICLES IN HOUSEHOLD
1.7/ 100
METRIC RATING
243rd/ 347
METRIC RANK
54.3%
2 OR MORE VEHICLES IN HOUSEHOLD
13.6/ 100
METRIC RATING
205th/ 347
METRIC RANK
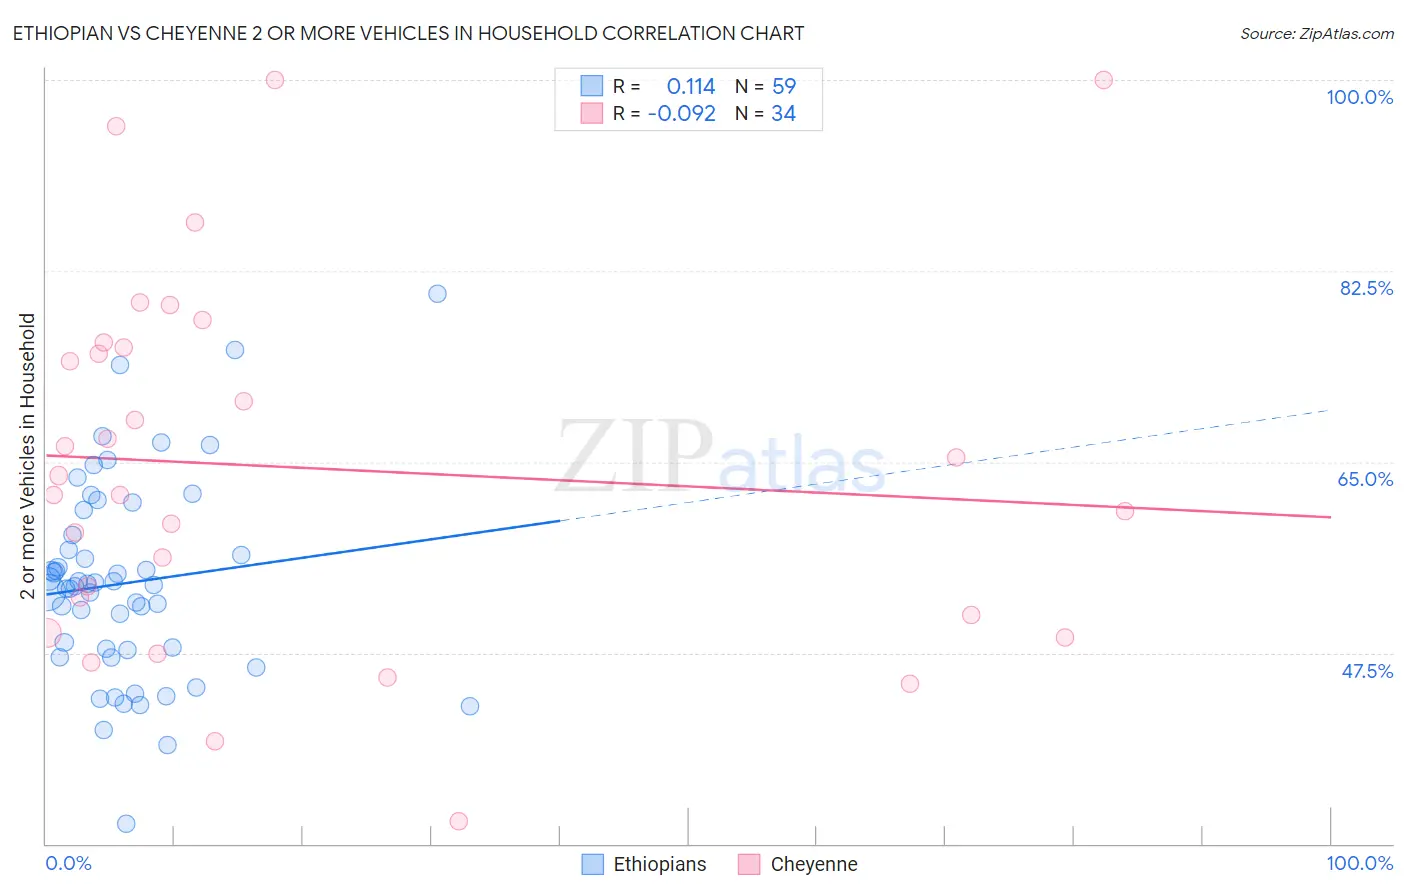
Ethiopian vs Cheyenne 2 or more Vehicles in Household Correlation Chart
The statistical analysis conducted on geographies consisting of 223,123,508 people shows a poor positive correlation between the proportion of Ethiopians and percentage of households with 2 or more vehicles available in the United States with a correlation coefficient (R) of 0.114 and weighted average of 53.1%. Similarly, the statistical analysis conducted on geographies consisting of 80,710,429 people shows a slight negative correlation between the proportion of Cheyenne and percentage of households with 2 or more vehicles available in the United States with a correlation coefficient (R) of -0.092 and weighted average of 54.3%, a difference of 2.3%.
2 or more Vehicles in Household Correlation Summary
| Measurement | Ethiopian | Cheyenne |
| Minimum | 31.9% | 32.0% |
| Maximum | 80.4% | 100.0% |
| Range | 48.5% | 68.0% |
| Mean | 53.9% | 64.5% |
| Median | 53.7% | 62.8% |
| Interquartile 25% (IQ1) | 47.7% | 51.0% |
| Interquartile 75% (IQ3) | 58.3% | 75.5% |
| Interquartile Range (IQR) | 10.5% | 24.5% |
| Standard Deviation (Sample) | 9.1% | 16.8% |
| Standard Deviation (Population) | 9.1% | 16.5% |
Similar Demographics by 2 or more Vehicles in Household
Demographics Similar to Ethiopians by 2 or more Vehicles in Household
In terms of 2 or more vehicles in household, the demographic groups most similar to Ethiopians are Indian (Asian) (53.1%, a difference of 0.040%), Immigrants from Ethiopia (53.0%, a difference of 0.16%), Immigrants from Eastern Asia (53.2%, a difference of 0.19%), Immigrants from Sierra Leone (53.2%, a difference of 0.20%), and Immigrants from Europe (53.2%, a difference of 0.23%).
| Demographics | Rating | Rank | 2 or more Vehicles in Household |
| Indonesians | 2.7 /100 | #236 | Tragic 53.4% |
| Macedonians | 2.4 /100 | #237 | Tragic 53.3% |
| Immigrants | Armenia | 2.3 /100 | #238 | Tragic 53.3% |
| Cambodians | 2.3 /100 | #239 | Tragic 53.3% |
| Immigrants | Europe | 2.1 /100 | #240 | Tragic 53.2% |
| Immigrants | Sierra Leone | 2.1 /100 | #241 | Tragic 53.2% |
| Immigrants | Eastern Asia | 2.1 /100 | #242 | Tragic 53.2% |
| Ethiopians | 1.7 /100 | #243 | Tragic 53.1% |
| Indians (Asian) | 1.7 /100 | #244 | Tragic 53.1% |
| Immigrants | Ethiopia | 1.5 /100 | #245 | Tragic 53.0% |
| Immigrants | Nigeria | 1.2 /100 | #246 | Tragic 52.9% |
| Sierra Leoneans | 1.2 /100 | #247 | Tragic 52.9% |
| Colombians | 1.1 /100 | #248 | Tragic 52.9% |
| Immigrants | Brazil | 1.0 /100 | #249 | Tragic 52.8% |
| Mongolians | 1.0 /100 | #250 | Tragic 52.8% |
Demographics Similar to Cheyenne by 2 or more Vehicles in Household
In terms of 2 or more vehicles in household, the demographic groups most similar to Cheyenne are Immigrants from Belgium (54.3%, a difference of 0.010%), Immigrants from Latin America (54.3%, a difference of 0.050%), Immigrants from Peru (54.4%, a difference of 0.060%), Turkish (54.3%, a difference of 0.060%), and Immigrants from North Macedonia (54.4%, a difference of 0.10%).
| Demographics | Rating | Rank | 2 or more Vehicles in Household |
| Carpatho Rusyns | 16.2 /100 | #198 | Poor 54.4% |
| Immigrants | Norway | 15.9 /100 | #199 | Poor 54.4% |
| Houma | 15.8 /100 | #200 | Poor 54.4% |
| Immigrants | Italy | 15.5 /100 | #201 | Poor 54.4% |
| Immigrants | North Macedonia | 14.9 /100 | #202 | Poor 54.4% |
| Immigrants | Peru | 14.3 /100 | #203 | Poor 54.4% |
| Immigrants | Belgium | 13.7 /100 | #204 | Poor 54.3% |
| Cheyenne | 13.6 /100 | #205 | Poor 54.3% |
| Immigrants | Latin America | 13.1 /100 | #206 | Poor 54.3% |
| Turks | 13.0 /100 | #207 | Poor 54.3% |
| Egyptians | 12.0 /100 | #208 | Poor 54.3% |
| Immigrants | Bulgaria | 12.0 /100 | #209 | Poor 54.3% |
| Immigrants | Saudi Arabia | 11.3 /100 | #210 | Poor 54.2% |
| Immigrants | Hungary | 11.3 /100 | #211 | Poor 54.2% |
| Immigrants | Chile | 11.1 /100 | #212 | Poor 54.2% |