Ethiopian vs Senegalese 2 or more Vehicles in Household
COMPARE
Ethiopian
Senegalese
2 or more Vehicles in Household
2 or more Vehicles in Household Comparison
Ethiopians
Senegalese
53.1%
2 OR MORE VEHICLES IN HOUSEHOLD
1.7/ 100
METRIC RATING
243rd/ 347
METRIC RANK
44.2%
2 OR MORE VEHICLES IN HOUSEHOLD
0.0/ 100
METRIC RATING
322nd/ 347
METRIC RANK
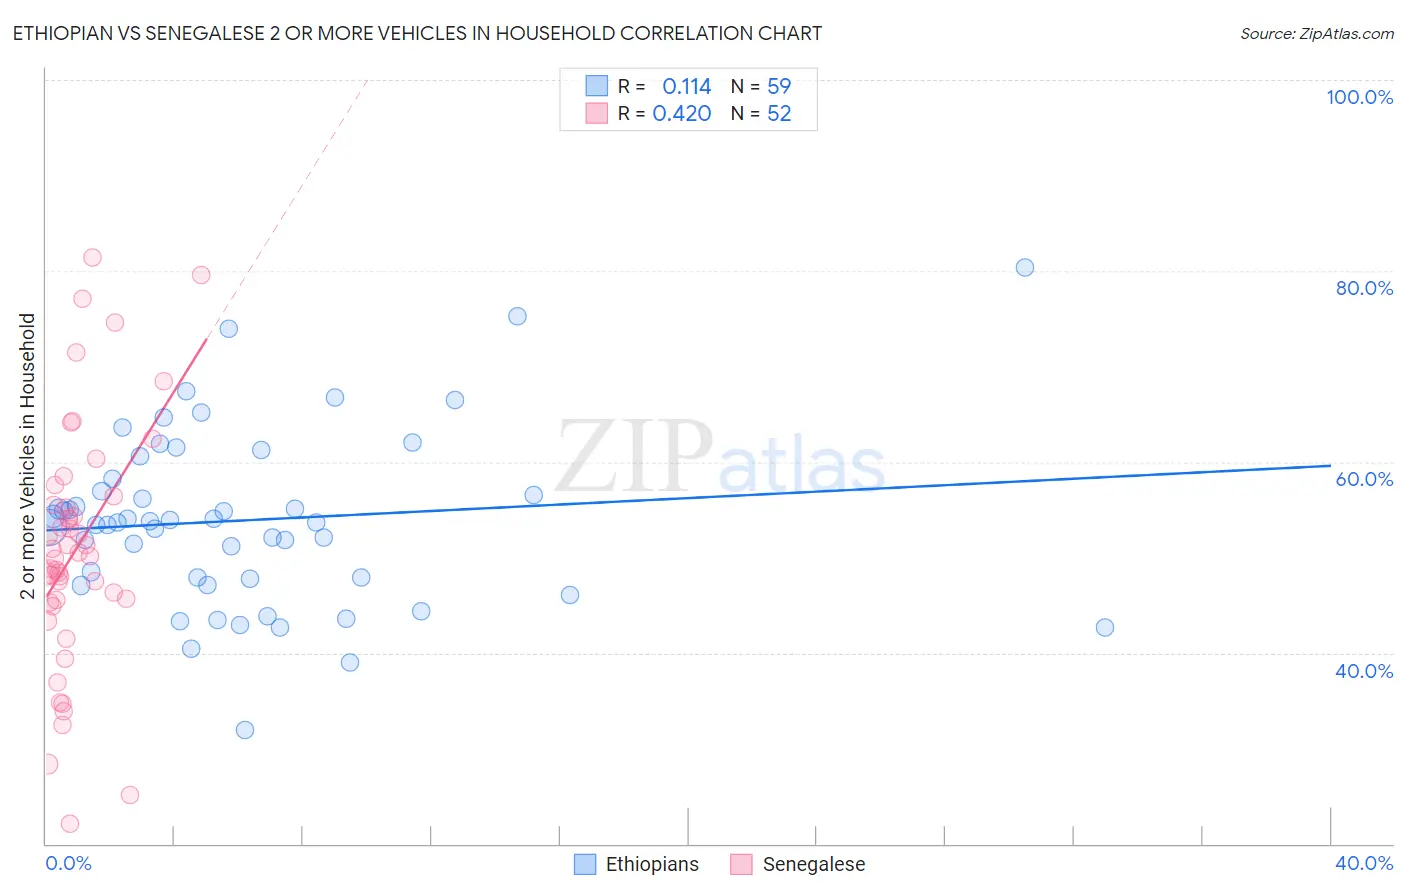
Ethiopian vs Senegalese 2 or more Vehicles in Household Correlation Chart
The statistical analysis conducted on geographies consisting of 223,123,508 people shows a poor positive correlation between the proportion of Ethiopians and percentage of households with 2 or more vehicles available in the United States with a correlation coefficient (R) of 0.114 and weighted average of 53.1%. Similarly, the statistical analysis conducted on geographies consisting of 78,083,411 people shows a moderate positive correlation between the proportion of Senegalese and percentage of households with 2 or more vehicles available in the United States with a correlation coefficient (R) of 0.420 and weighted average of 44.2%, a difference of 20.1%.
2 or more Vehicles in Household Correlation Summary
| Measurement | Ethiopian | Senegalese |
| Minimum | 31.9% | 22.1% |
| Maximum | 80.4% | 81.4% |
| Range | 48.5% | 59.3% |
| Mean | 53.9% | 51.0% |
| Median | 53.7% | 50.3% |
| Interquartile 25% (IQ1) | 47.7% | 45.5% |
| Interquartile 75% (IQ3) | 58.3% | 56.0% |
| Interquartile Range (IQR) | 10.5% | 10.5% |
| Standard Deviation (Sample) | 9.1% | 12.8% |
| Standard Deviation (Population) | 9.1% | 12.7% |
Similar Demographics by 2 or more Vehicles in Household
Demographics Similar to Ethiopians by 2 or more Vehicles in Household
In terms of 2 or more vehicles in household, the demographic groups most similar to Ethiopians are Indian (Asian) (53.1%, a difference of 0.040%), Immigrants from Ethiopia (53.0%, a difference of 0.16%), Immigrants from Eastern Asia (53.2%, a difference of 0.19%), Immigrants from Sierra Leone (53.2%, a difference of 0.20%), and Immigrants from Europe (53.2%, a difference of 0.23%).
| Demographics | Rating | Rank | 2 or more Vehicles in Household |
| Indonesians | 2.7 /100 | #236 | Tragic 53.4% |
| Macedonians | 2.4 /100 | #237 | Tragic 53.3% |
| Immigrants | Armenia | 2.3 /100 | #238 | Tragic 53.3% |
| Cambodians | 2.3 /100 | #239 | Tragic 53.3% |
| Immigrants | Europe | 2.1 /100 | #240 | Tragic 53.2% |
| Immigrants | Sierra Leone | 2.1 /100 | #241 | Tragic 53.2% |
| Immigrants | Eastern Asia | 2.1 /100 | #242 | Tragic 53.2% |
| Ethiopians | 1.7 /100 | #243 | Tragic 53.1% |
| Indians (Asian) | 1.7 /100 | #244 | Tragic 53.1% |
| Immigrants | Ethiopia | 1.5 /100 | #245 | Tragic 53.0% |
| Immigrants | Nigeria | 1.2 /100 | #246 | Tragic 52.9% |
| Sierra Leoneans | 1.2 /100 | #247 | Tragic 52.9% |
| Colombians | 1.1 /100 | #248 | Tragic 52.9% |
| Immigrants | Brazil | 1.0 /100 | #249 | Tragic 52.8% |
| Mongolians | 1.0 /100 | #250 | Tragic 52.8% |
Demographics Similar to Senegalese by 2 or more Vehicles in Household
In terms of 2 or more vehicles in household, the demographic groups most similar to Senegalese are Immigrants from Caribbean (44.2%, a difference of 0.020%), Immigrants from Jamaica (44.5%, a difference of 0.55%), Immigrants from Cabo Verde (43.3%, a difference of 2.1%), Immigrants from West Indies (43.1%, a difference of 2.6%), and Immigrants from Senegal (43.0%, a difference of 2.8%).
| Demographics | Rating | Rank | 2 or more Vehicles in Household |
| Puerto Ricans | 0.0 /100 | #315 | Tragic 47.1% |
| Cape Verdeans | 0.0 /100 | #316 | Tragic 46.8% |
| Immigrants | Haiti | 0.0 /100 | #317 | Tragic 46.5% |
| Immigrants | Albania | 0.0 /100 | #318 | Tragic 46.0% |
| Jamaicans | 0.0 /100 | #319 | Tragic 45.8% |
| Soviet Union | 0.0 /100 | #320 | Tragic 45.7% |
| Immigrants | Jamaica | 0.0 /100 | #321 | Tragic 44.5% |
| Senegalese | 0.0 /100 | #322 | Tragic 44.2% |
| Immigrants | Caribbean | 0.0 /100 | #323 | Tragic 44.2% |
| Immigrants | Cabo Verde | 0.0 /100 | #324 | Tragic 43.3% |
| Immigrants | West Indies | 0.0 /100 | #325 | Tragic 43.1% |
| Immigrants | Senegal | 0.0 /100 | #326 | Tragic 43.0% |
| Immigrants | Yemen | 0.0 /100 | #327 | Tragic 42.8% |
| Inupiat | 0.0 /100 | #328 | Tragic 42.6% |
| Ecuadorians | 0.0 /100 | #329 | Tragic 42.0% |