Ethiopian vs Immigrants from Fiji 2 or more Vehicles in Household
COMPARE
Ethiopian
Immigrants from Fiji
2 or more Vehicles in Household
2 or more Vehicles in Household Comparison
Ethiopians
Immigrants from Fiji
53.1%
2 OR MORE VEHICLES IN HOUSEHOLD
1.7/ 100
METRIC RATING
243rd/ 347
METRIC RANK
62.3%
2 OR MORE VEHICLES IN HOUSEHOLD
100.0/ 100
METRIC RATING
5th/ 347
METRIC RANK
Ethiopian vs Immigrants from Fiji 2 or more Vehicles in Household Correlation Chart
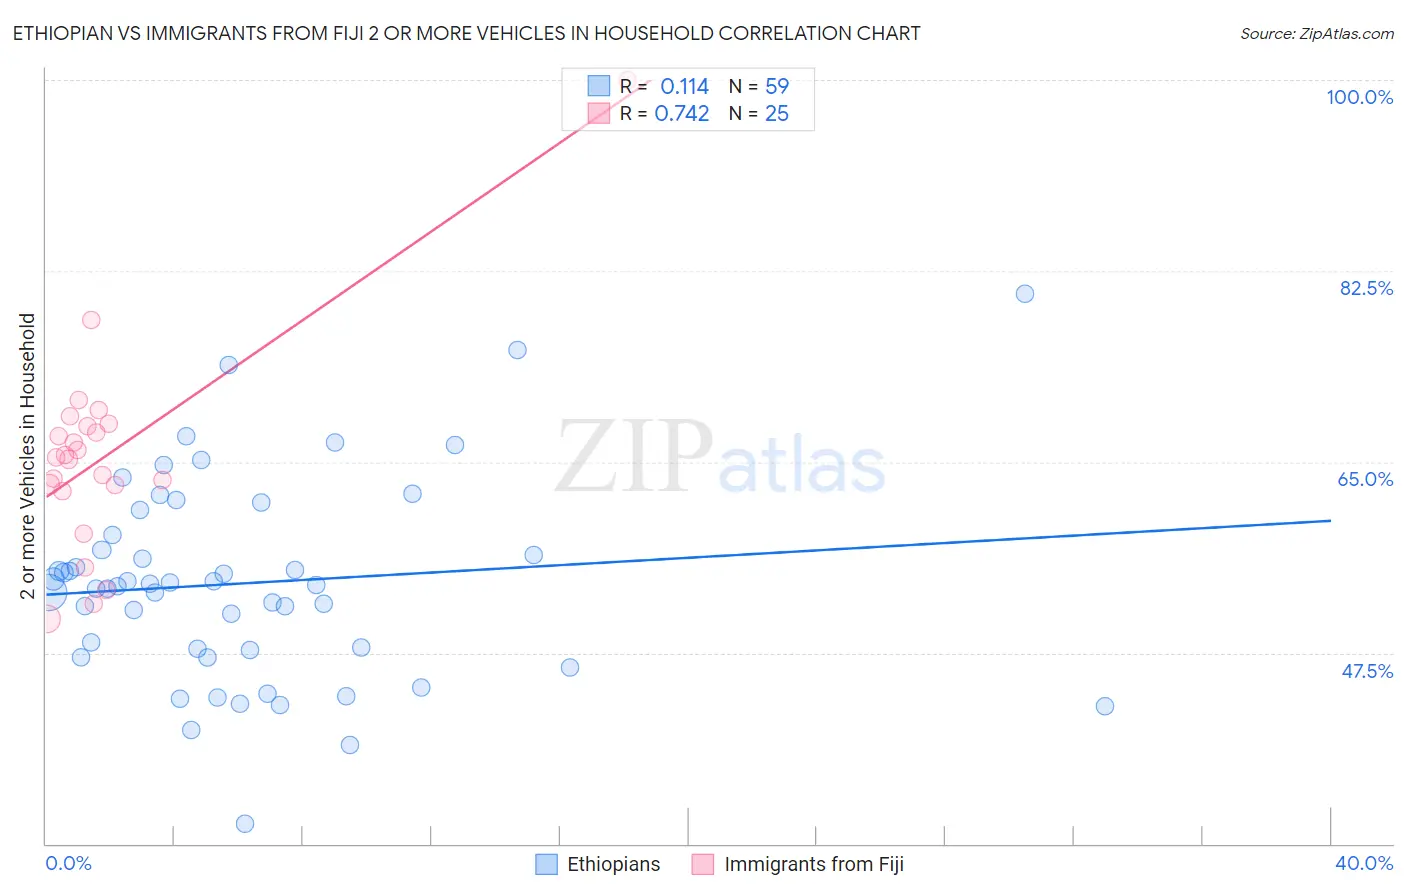
The statistical analysis conducted on geographies consisting of 223,123,508 people shows a poor positive correlation between the proportion of Ethiopians and percentage of households with 2 or more vehicles available in the United States with a correlation coefficient (R) of 0.114 and weighted average of 53.1%. Similarly, the statistical analysis conducted on geographies consisting of 93,754,900 people shows a strong positive correlation between the proportion of Immigrants from Fiji and percentage of households with 2 or more vehicles available in the United States with a correlation coefficient (R) of 0.742 and weighted average of 62.3%, a difference of 17.3%.
2 or more Vehicles in Household Correlation Summary
| Measurement | Ethiopian | Immigrants from Fiji |
| Minimum | 31.9% | 50.6% |
| Maximum | 80.4% | 100.0% |
| Range | 48.5% | 49.4% |
| Mean | 53.9% | 65.5% |
| Median | 53.7% | 65.5% |
| Interquartile 25% (IQ1) | 47.7% | 62.6% |
| Interquartile 75% (IQ3) | 58.3% | 68.4% |
| Interquartile Range (IQR) | 10.5% | 5.9% |
| Standard Deviation (Sample) | 9.1% | 9.5% |
| Standard Deviation (Population) | 9.1% | 9.3% |
Similar Demographics by 2 or more Vehicles in Household
Demographics Similar to Ethiopians by 2 or more Vehicles in Household
In terms of 2 or more vehicles in household, the demographic groups most similar to Ethiopians are Indian (Asian) (53.1%, a difference of 0.040%), Immigrants from Ethiopia (53.0%, a difference of 0.16%), Immigrants from Eastern Asia (53.2%, a difference of 0.19%), Immigrants from Sierra Leone (53.2%, a difference of 0.20%), and Immigrants from Europe (53.2%, a difference of 0.23%).
| Demographics | Rating | Rank | 2 or more Vehicles in Household |
| Indonesians | 2.7 /100 | #236 | Tragic 53.4% |
| Macedonians | 2.4 /100 | #237 | Tragic 53.3% |
| Immigrants | Armenia | 2.3 /100 | #238 | Tragic 53.3% |
| Cambodians | 2.3 /100 | #239 | Tragic 53.3% |
| Immigrants | Europe | 2.1 /100 | #240 | Tragic 53.2% |
| Immigrants | Sierra Leone | 2.1 /100 | #241 | Tragic 53.2% |
| Immigrants | Eastern Asia | 2.1 /100 | #242 | Tragic 53.2% |
| Ethiopians | 1.7 /100 | #243 | Tragic 53.1% |
| Indians (Asian) | 1.7 /100 | #244 | Tragic 53.1% |
| Immigrants | Ethiopia | 1.5 /100 | #245 | Tragic 53.0% |
| Immigrants | Nigeria | 1.2 /100 | #246 | Tragic 52.9% |
| Sierra Leoneans | 1.2 /100 | #247 | Tragic 52.9% |
| Colombians | 1.1 /100 | #248 | Tragic 52.9% |
| Immigrants | Brazil | 1.0 /100 | #249 | Tragic 52.8% |
| Mongolians | 1.0 /100 | #250 | Tragic 52.8% |
Demographics Similar to Immigrants from Fiji by 2 or more Vehicles in Household
In terms of 2 or more vehicles in household, the demographic groups most similar to Immigrants from Fiji are Scandinavian (62.1%, a difference of 0.34%), Puget Sound Salish (62.1%, a difference of 0.40%), English (61.9%, a difference of 0.67%), Swedish (61.8%, a difference of 0.74%), and Norwegian (62.8%, a difference of 0.87%).
| Demographics | Rating | Rank | 2 or more Vehicles in Household |
| Yakama | 100.0 /100 | #1 | Exceptional 64.9% |
| Tongans | 100.0 /100 | #2 | Exceptional 63.5% |
| Danes | 100.0 /100 | #3 | Exceptional 63.3% |
| Norwegians | 100.0 /100 | #4 | Exceptional 62.8% |
| Immigrants | Fiji | 100.0 /100 | #5 | Exceptional 62.3% |
| Scandinavians | 100.0 /100 | #6 | Exceptional 62.1% |
| Puget Sound Salish | 100.0 /100 | #7 | Exceptional 62.1% |
| English | 100.0 /100 | #8 | Exceptional 61.9% |
| Swedes | 100.0 /100 | #9 | Exceptional 61.8% |
| Mexicans | 100.0 /100 | #10 | Exceptional 61.7% |
| Dutch | 100.0 /100 | #11 | Exceptional 61.6% |
| Germans | 100.0 /100 | #12 | Exceptional 61.6% |
| Samoans | 100.0 /100 | #13 | Exceptional 61.5% |
| Czechs | 100.0 /100 | #14 | Exceptional 61.5% |
| Nepalese | 100.0 /100 | #15 | Exceptional 61.4% |