Ethiopian vs Cheyenne 1 or more Vehicles in Household
COMPARE
Ethiopian
Cheyenne
1 or more Vehicles in Household
1 or more Vehicles in Household Comparison
Ethiopians
Cheyenne
89.6%
1 OR MORE VEHICLES IN HOUSEHOLD
41.2/ 100
METRIC RATING
183rd/ 347
METRIC RANK
88.7%
1 OR MORE VEHICLES IN HOUSEHOLD
5.7/ 100
METRIC RATING
226th/ 347
METRIC RANK
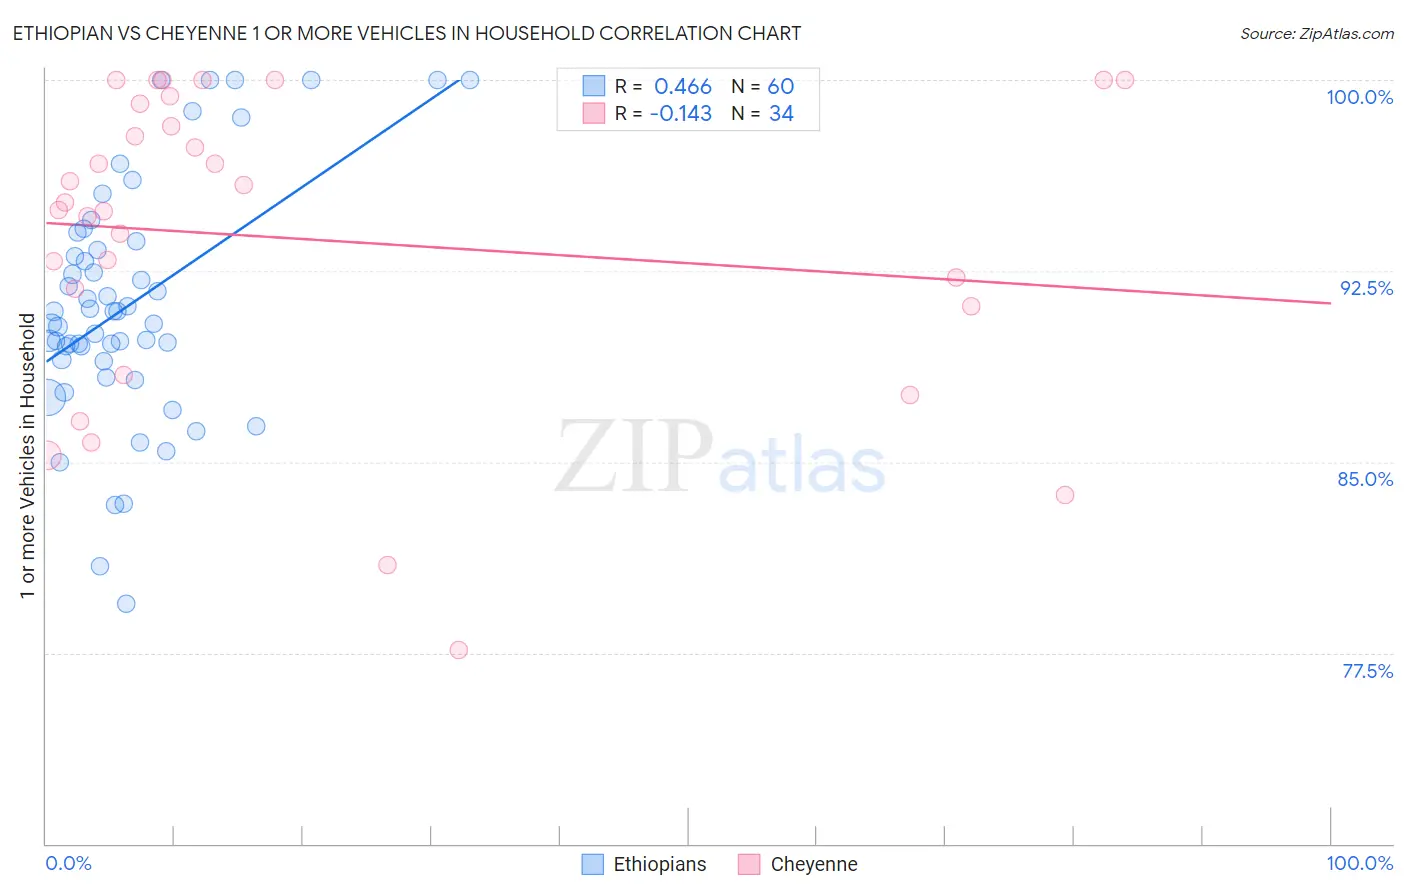
Ethiopian vs Cheyenne 1 or more Vehicles in Household Correlation Chart
The statistical analysis conducted on geographies consisting of 223,130,075 people shows a moderate positive correlation between the proportion of Ethiopians and percentage of households with 1 or more vehicles available in the United States with a correlation coefficient (R) of 0.466 and weighted average of 89.6%. Similarly, the statistical analysis conducted on geographies consisting of 80,710,429 people shows a poor negative correlation between the proportion of Cheyenne and percentage of households with 1 or more vehicles available in the United States with a correlation coefficient (R) of -0.143 and weighted average of 88.7%, a difference of 0.96%.
1 or more Vehicles in Household Correlation Summary
| Measurement | Ethiopian | Cheyenne |
| Minimum | 79.4% | 77.6% |
| Maximum | 100.0% | 100.0% |
| Range | 20.6% | 22.4% |
| Mean | 91.2% | 93.8% |
| Median | 90.7% | 95.1% |
| Interquartile 25% (IQ1) | 89.0% | 91.1% |
| Interquartile 75% (IQ3) | 93.5% | 99.1% |
| Interquartile Range (IQR) | 4.5% | 7.9% |
| Standard Deviation (Sample) | 4.7% | 6.0% |
| Standard Deviation (Population) | 4.7% | 6.0% |
Similar Demographics by 1 or more Vehicles in Household
Demographics Similar to Ethiopians by 1 or more Vehicles in Household
In terms of 1 or more vehicles in household, the demographic groups most similar to Ethiopians are Immigrants from Bulgaria (89.6%, a difference of 0.010%), Immigrants from Ethiopia (89.6%, a difference of 0.020%), Ukrainian (89.6%, a difference of 0.020%), Immigrants from Brazil (89.6%, a difference of 0.020%), and Pueblo (89.6%, a difference of 0.020%).
| Demographics | Rating | Rank | 1 or more Vehicles in Household |
| Immigrants | Sudan | 47.1 /100 | #176 | Average 89.7% |
| Hmong | 45.8 /100 | #177 | Average 89.6% |
| Immigrants | El Salvador | 44.1 /100 | #178 | Average 89.6% |
| German Russians | 44.0 /100 | #179 | Average 89.6% |
| Arabs | 43.3 /100 | #180 | Average 89.6% |
| Immigrants | Ethiopia | 42.5 /100 | #181 | Average 89.6% |
| Ukrainians | 42.4 /100 | #182 | Average 89.6% |
| Ethiopians | 41.2 /100 | #183 | Average 89.6% |
| Immigrants | Bulgaria | 40.7 /100 | #184 | Average 89.6% |
| Immigrants | Brazil | 40.1 /100 | #185 | Average 89.6% |
| Pueblo | 39.9 /100 | #186 | Fair 89.6% |
| South Americans | 39.6 /100 | #187 | Fair 89.5% |
| Immigrants | Nepal | 38.9 /100 | #188 | Fair 89.5% |
| Carpatho Rusyns | 37.8 /100 | #189 | Fair 89.5% |
| Shoshone | 37.5 /100 | #190 | Fair 89.5% |
Demographics Similar to Cheyenne by 1 or more Vehicles in Household
In terms of 1 or more vehicles in household, the demographic groups most similar to Cheyenne are Ute (88.7%, a difference of 0.0%), Immigrants from Norway (88.7%, a difference of 0.010%), Immigrants from Romania (88.7%, a difference of 0.020%), Cree (88.7%, a difference of 0.030%), and Immigrants from Hong Kong (88.7%, a difference of 0.040%).
| Demographics | Rating | Rank | 1 or more Vehicles in Household |
| Immigrants | Guatemala | 8.6 /100 | #219 | Tragic 88.9% |
| Immigrants | Zaire | 8.1 /100 | #220 | Tragic 88.8% |
| Peruvians | 7.9 /100 | #221 | Tragic 88.8% |
| Uruguayans | 7.0 /100 | #222 | Tragic 88.8% |
| Immigrants | South America | 7.0 /100 | #223 | Tragic 88.8% |
| Immigrants | Hong Kong | 6.2 /100 | #224 | Tragic 88.7% |
| Cree | 6.0 /100 | #225 | Tragic 88.7% |
| Cheyenne | 5.7 /100 | #226 | Tragic 88.7% |
| Ute | 5.6 /100 | #227 | Tragic 88.7% |
| Immigrants | Norway | 5.5 /100 | #228 | Tragic 88.7% |
| Immigrants | Romania | 5.4 /100 | #229 | Tragic 88.7% |
| Immigrants | Sierra Leone | 5.2 /100 | #230 | Tragic 88.7% |
| Russians | 5.0 /100 | #231 | Tragic 88.7% |
| Immigrants | Japan | 4.9 /100 | #232 | Tragic 88.7% |
| Houma | 4.8 /100 | #233 | Tragic 88.6% |