Ethiopian vs Apache 2 or more Vehicles in Household
COMPARE
Ethiopian
Apache
2 or more Vehicles in Household
2 or more Vehicles in Household Comparison
Ethiopians
Apache
53.1%
2 OR MORE VEHICLES IN HOUSEHOLD
1.7/ 100
METRIC RATING
243rd/ 347
METRIC RANK
55.1%
2 OR MORE VEHICLES IN HOUSEHOLD
36.7/ 100
METRIC RATING
184th/ 347
METRIC RANK
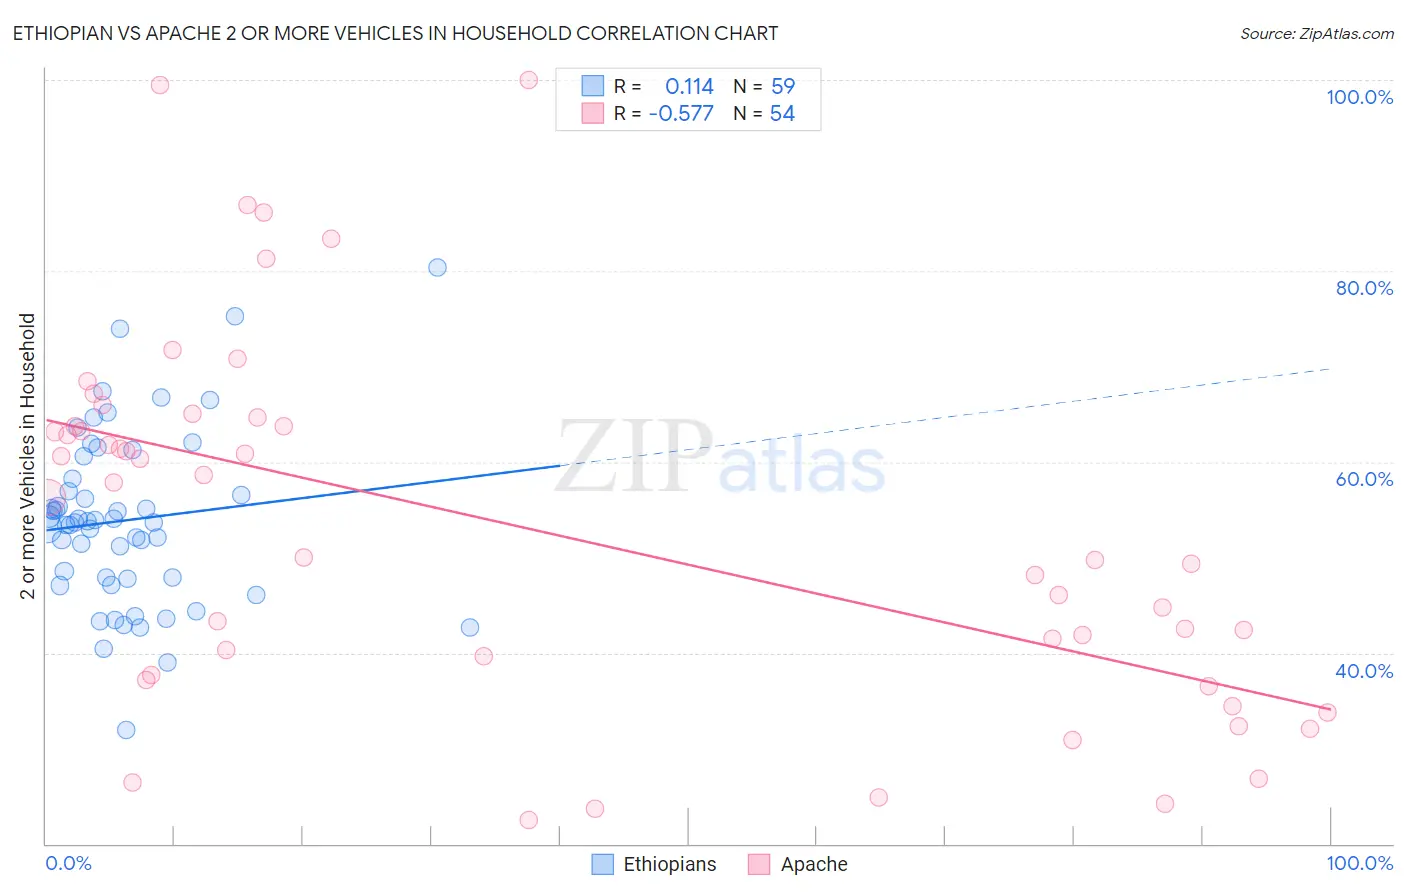
Ethiopian vs Apache 2 or more Vehicles in Household Correlation Chart
The statistical analysis conducted on geographies consisting of 223,123,508 people shows a poor positive correlation between the proportion of Ethiopians and percentage of households with 2 or more vehicles available in the United States with a correlation coefficient (R) of 0.114 and weighted average of 53.1%. Similarly, the statistical analysis conducted on geographies consisting of 231,042,318 people shows a substantial negative correlation between the proportion of Apache and percentage of households with 2 or more vehicles available in the United States with a correlation coefficient (R) of -0.577 and weighted average of 55.1%, a difference of 3.6%.
2 or more Vehicles in Household Correlation Summary
| Measurement | Ethiopian | Apache |
| Minimum | 31.9% | 22.4% |
| Maximum | 80.4% | 100.0% |
| Range | 48.5% | 77.6% |
| Mean | 53.9% | 53.1% |
| Median | 53.7% | 53.1% |
| Interquartile 25% (IQ1) | 47.7% | 37.7% |
| Interquartile 75% (IQ3) | 58.3% | 63.7% |
| Interquartile Range (IQR) | 10.5% | 26.0% |
| Standard Deviation (Sample) | 9.1% | 19.2% |
| Standard Deviation (Population) | 9.1% | 19.1% |
Similar Demographics by 2 or more Vehicles in Household
Demographics Similar to Ethiopians by 2 or more Vehicles in Household
In terms of 2 or more vehicles in household, the demographic groups most similar to Ethiopians are Indian (Asian) (53.1%, a difference of 0.040%), Immigrants from Ethiopia (53.0%, a difference of 0.16%), Immigrants from Eastern Asia (53.2%, a difference of 0.19%), Immigrants from Sierra Leone (53.2%, a difference of 0.20%), and Immigrants from Europe (53.2%, a difference of 0.23%).
| Demographics | Rating | Rank | 2 or more Vehicles in Household |
| Indonesians | 2.7 /100 | #236 | Tragic 53.4% |
| Macedonians | 2.4 /100 | #237 | Tragic 53.3% |
| Immigrants | Armenia | 2.3 /100 | #238 | Tragic 53.3% |
| Cambodians | 2.3 /100 | #239 | Tragic 53.3% |
| Immigrants | Europe | 2.1 /100 | #240 | Tragic 53.2% |
| Immigrants | Sierra Leone | 2.1 /100 | #241 | Tragic 53.2% |
| Immigrants | Eastern Asia | 2.1 /100 | #242 | Tragic 53.2% |
| Ethiopians | 1.7 /100 | #243 | Tragic 53.1% |
| Indians (Asian) | 1.7 /100 | #244 | Tragic 53.1% |
| Immigrants | Ethiopia | 1.5 /100 | #245 | Tragic 53.0% |
| Immigrants | Nigeria | 1.2 /100 | #246 | Tragic 52.9% |
| Sierra Leoneans | 1.2 /100 | #247 | Tragic 52.9% |
| Colombians | 1.1 /100 | #248 | Tragic 52.9% |
| Immigrants | Brazil | 1.0 /100 | #249 | Tragic 52.8% |
| Mongolians | 1.0 /100 | #250 | Tragic 52.8% |
Demographics Similar to Apache by 2 or more Vehicles in Household
In terms of 2 or more vehicles in household, the demographic groups most similar to Apache are Immigrants from Cameroon (55.1%, a difference of 0.030%), Arab (55.0%, a difference of 0.030%), Immigrants from Micronesia (55.1%, a difference of 0.060%), Cree (55.1%, a difference of 0.060%), and Peruvian (55.0%, a difference of 0.13%).
| Demographics | Rating | Rank | 2 or more Vehicles in Household |
| Menominee | 46.2 /100 | #177 | Average 55.3% |
| Immigrants | Sweden | 45.3 /100 | #178 | Average 55.2% |
| Alaskan Athabascans | 42.9 /100 | #179 | Average 55.2% |
| Immigrants | Kenya | 40.4 /100 | #180 | Average 55.1% |
| Immigrants | Micronesia | 38.2 /100 | #181 | Fair 55.1% |
| Cree | 38.2 /100 | #182 | Fair 55.1% |
| Immigrants | Cameroon | 37.3 /100 | #183 | Fair 55.1% |
| Apache | 36.7 /100 | #184 | Fair 55.1% |
| Arabs | 35.9 /100 | #185 | Fair 55.0% |
| Peruvians | 33.7 /100 | #186 | Fair 55.0% |
| Immigrants | Uganda | 33.4 /100 | #187 | Fair 55.0% |
| Marshallese | 30.5 /100 | #188 | Fair 54.9% |
| Eastern Europeans | 27.5 /100 | #189 | Fair 54.8% |
| Russians | 26.3 /100 | #190 | Fair 54.8% |
| Immigrants | Immigrants | 25.0 /100 | #191 | Fair 54.7% |