Ethiopian vs Apache Family Households with Children
COMPARE
Ethiopian
Apache
Family Households with Children
Family Households with Children Comparison
Ethiopians
Apache
27.6%
FAMILY HOUSEHOLDS WITH CHILDREN
77.0/ 100
METRIC RATING
152nd/ 347
METRIC RANK
29.0%
FAMILY HOUSEHOLDS WITH CHILDREN
100.0/ 100
METRIC RATING
48th/ 347
METRIC RANK
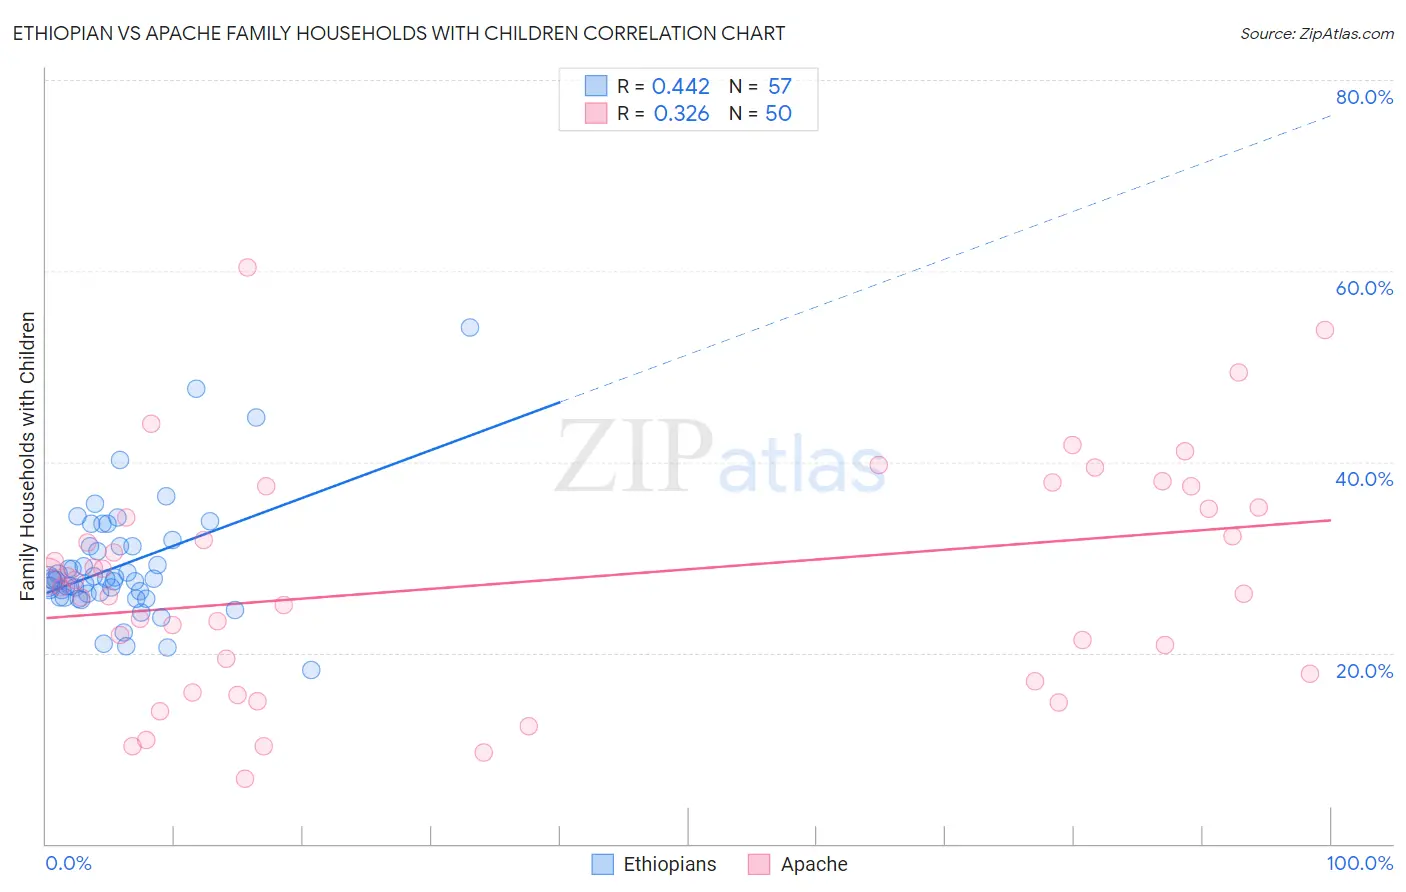
Ethiopian vs Apache Family Households with Children Correlation Chart
The statistical analysis conducted on geographies consisting of 223,037,255 people shows a moderate positive correlation between the proportion of Ethiopians and percentage of family households with children in the United States with a correlation coefficient (R) of 0.442 and weighted average of 27.6%. Similarly, the statistical analysis conducted on geographies consisting of 231,023,024 people shows a mild positive correlation between the proportion of Apache and percentage of family households with children in the United States with a correlation coefficient (R) of 0.326 and weighted average of 29.0%, a difference of 4.9%.
Family Households with Children Correlation Summary
| Measurement | Ethiopian | Apache |
| Minimum | 18.2% | 6.8% |
| Maximum | 54.1% | 60.3% |
| Range | 35.9% | 53.6% |
| Mean | 29.2% | 27.5% |
| Median | 27.6% | 27.2% |
| Interquartile 25% (IQ1) | 26.0% | 17.8% |
| Interquartile 75% (IQ3) | 31.2% | 35.2% |
| Interquartile Range (IQR) | 5.1% | 17.4% |
| Standard Deviation (Sample) | 6.2% | 11.9% |
| Standard Deviation (Population) | 6.2% | 11.8% |
Similar Demographics by Family Households with Children
Demographics Similar to Ethiopians by Family Households with Children
In terms of family households with children, the demographic groups most similar to Ethiopians are Portuguese (27.6%, a difference of 0.030%), Immigrants from Cabo Verde (27.6%, a difference of 0.040%), Argentinean (27.6%, a difference of 0.050%), Icelander (27.6%, a difference of 0.050%), and Osage (27.6%, a difference of 0.060%).
| Demographics | Rating | Rank | Family Households with Children |
| Immigrants | Chile | 79.5 /100 | #145 | Good 27.7% |
| Basques | 79.5 /100 | #146 | Good 27.7% |
| Immigrants | Moldova | 79.1 /100 | #147 | Good 27.6% |
| Osage | 79.0 /100 | #148 | Good 27.6% |
| Menominee | 78.9 /100 | #149 | Good 27.6% |
| Argentineans | 78.5 /100 | #150 | Good 27.6% |
| Portuguese | 77.8 /100 | #151 | Good 27.6% |
| Ethiopians | 77.0 /100 | #152 | Good 27.6% |
| Immigrants | Cabo Verde | 75.6 /100 | #153 | Good 27.6% |
| Icelanders | 75.3 /100 | #154 | Good 27.6% |
| Comanche | 74.8 /100 | #155 | Good 27.6% |
| Hungarians | 74.6 /100 | #156 | Good 27.6% |
| Indians (Asian) | 71.6 /100 | #157 | Good 27.6% |
| Romanians | 70.8 /100 | #158 | Good 27.6% |
| Mongolians | 70.7 /100 | #159 | Good 27.6% |
Demographics Similar to Apache by Family Households with Children
In terms of family households with children, the demographic groups most similar to Apache are Peruvian (29.0%, a difference of 0.030%), Immigrants from Philippines (29.0%, a difference of 0.040%), Jordanian (29.0%, a difference of 0.090%), Fijian (29.0%, a difference of 0.13%), and Immigrants from Taiwan (29.0%, a difference of 0.18%).
| Demographics | Rating | Rank | Family Households with Children |
| Immigrants | South Eastern Asia | 100.0 /100 | #41 | Exceptional 29.1% |
| Spanish American Indians | 100.0 /100 | #42 | Exceptional 29.1% |
| Asians | 100.0 /100 | #43 | Exceptional 29.1% |
| Immigrants | Taiwan | 100.0 /100 | #44 | Exceptional 29.0% |
| Fijians | 100.0 /100 | #45 | Exceptional 29.0% |
| Immigrants | Philippines | 100.0 /100 | #46 | Exceptional 29.0% |
| Peruvians | 100.0 /100 | #47 | Exceptional 29.0% |
| Apache | 100.0 /100 | #48 | Exceptional 29.0% |
| Jordanians | 100.0 /100 | #49 | Exceptional 29.0% |
| Immigrants | Immigrants | 100.0 /100 | #50 | Exceptional 28.9% |
| Immigrants | Peru | 100.0 /100 | #51 | Exceptional 28.9% |
| Guatemalans | 100.0 /100 | #52 | Exceptional 28.9% |
| Immigrants | Cambodia | 100.0 /100 | #53 | Exceptional 28.9% |
| Sierra Leoneans | 100.0 /100 | #54 | Exceptional 28.9% |
| Immigrants | Asia | 100.0 /100 | #55 | Exceptional 28.8% |