Immigrants from Bolivia vs Apache 2 or more Vehicles in Household
COMPARE
Immigrants from Bolivia
Apache
2 or more Vehicles in Household
2 or more Vehicles in Household Comparison
Immigrants from Bolivia
Apache
57.6%
2 OR MORE VEHICLES IN HOUSEHOLD
98.2/ 100
METRIC RATING
102nd/ 347
METRIC RANK
55.1%
2 OR MORE VEHICLES IN HOUSEHOLD
36.7/ 100
METRIC RATING
184th/ 347
METRIC RANK
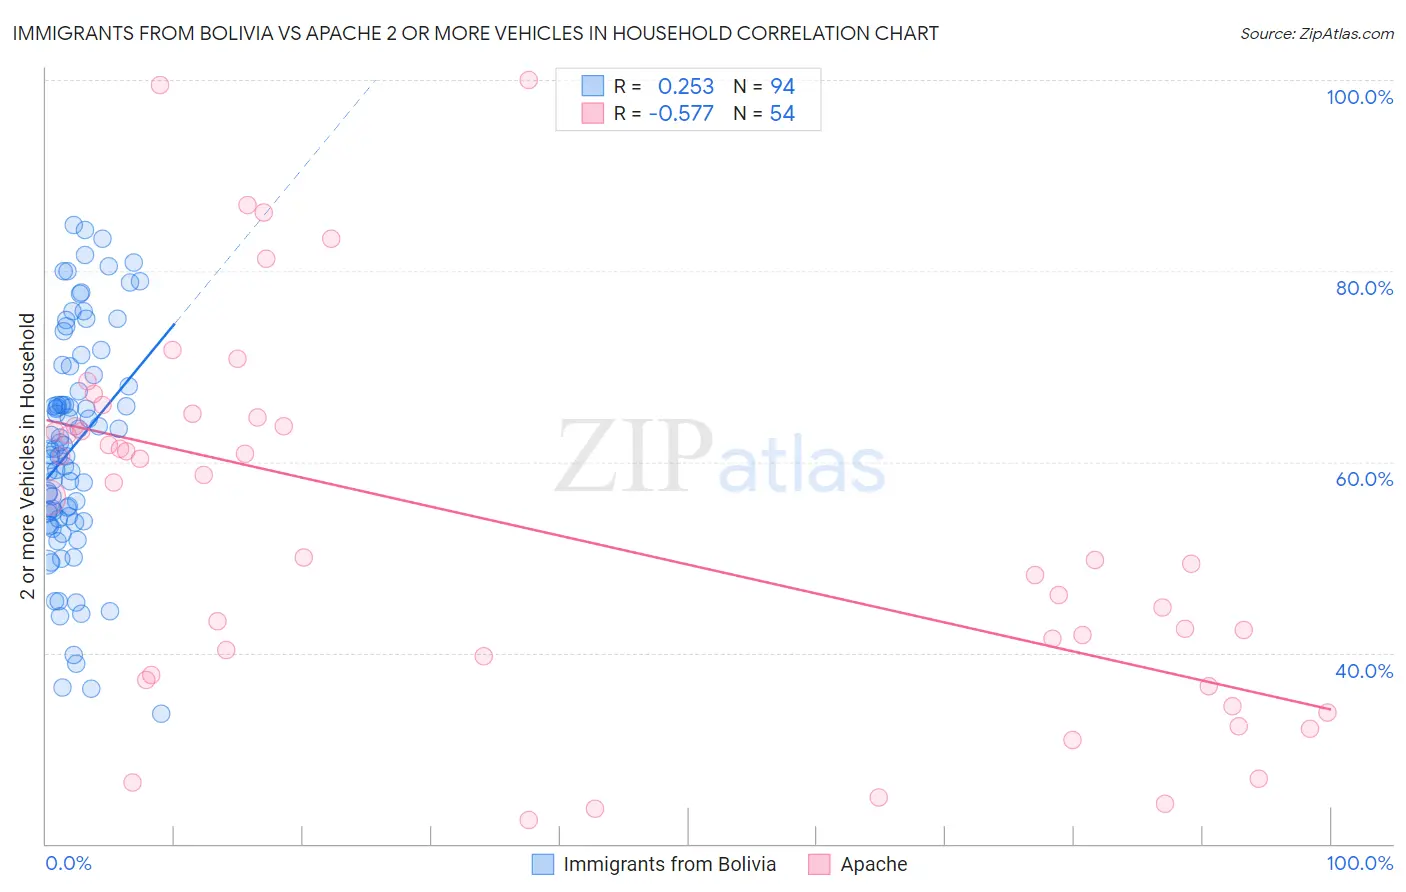
Immigrants from Bolivia vs Apache 2 or more Vehicles in Household Correlation Chart
The statistical analysis conducted on geographies consisting of 158,713,360 people shows a weak positive correlation between the proportion of Immigrants from Bolivia and percentage of households with 2 or more vehicles available in the United States with a correlation coefficient (R) of 0.253 and weighted average of 57.6%. Similarly, the statistical analysis conducted on geographies consisting of 231,042,318 people shows a substantial negative correlation between the proportion of Apache and percentage of households with 2 or more vehicles available in the United States with a correlation coefficient (R) of -0.577 and weighted average of 55.1%, a difference of 4.6%.
2 or more Vehicles in Household Correlation Summary
| Measurement | Immigrants from Bolivia | Apache |
| Minimum | 33.7% | 22.4% |
| Maximum | 84.8% | 100.0% |
| Range | 51.2% | 77.6% |
| Mean | 61.6% | 53.1% |
| Median | 61.4% | 53.1% |
| Interquartile 25% (IQ1) | 54.1% | 37.7% |
| Interquartile 75% (IQ3) | 69.1% | 63.7% |
| Interquartile Range (IQR) | 15.1% | 26.0% |
| Standard Deviation (Sample) | 11.8% | 19.2% |
| Standard Deviation (Population) | 11.7% | 19.1% |
Similar Demographics by 2 or more Vehicles in Household
Demographics Similar to Immigrants from Bolivia by 2 or more Vehicles in Household
In terms of 2 or more vehicles in household, the demographic groups most similar to Immigrants from Bolivia are Jordanian (57.6%, a difference of 0.0%), Immigrants from Indonesia (57.6%, a difference of 0.0%), Immigrants from Korea (57.6%, a difference of 0.010%), Immigrants from Oceania (57.5%, a difference of 0.020%), and Immigrants from Netherlands (57.5%, a difference of 0.040%).
| Demographics | Rating | Rank | 2 or more Vehicles in Household |
| Hmong | 98.9 /100 | #95 | Exceptional 57.8% |
| Burmese | 98.8 /100 | #96 | Exceptional 57.8% |
| Slavs | 98.8 /100 | #97 | Exceptional 57.8% |
| Palestinians | 98.6 /100 | #98 | Exceptional 57.7% |
| Cajuns | 98.5 /100 | #99 | Exceptional 57.7% |
| Fijians | 98.4 /100 | #100 | Exceptional 57.6% |
| Lebanese | 98.3 /100 | #101 | Exceptional 57.6% |
| Immigrants | Bolivia | 98.2 /100 | #102 | Exceptional 57.6% |
| Jordanians | 98.2 /100 | #103 | Exceptional 57.6% |
| Immigrants | Indonesia | 98.2 /100 | #104 | Exceptional 57.6% |
| Immigrants | Korea | 98.2 /100 | #105 | Exceptional 57.6% |
| Immigrants | Oceania | 98.2 /100 | #106 | Exceptional 57.5% |
| Immigrants | Netherlands | 98.2 /100 | #107 | Exceptional 57.5% |
| Immigrants | Canada | 98.1 /100 | #108 | Exceptional 57.5% |
| Immigrants | North America | 98.1 /100 | #109 | Exceptional 57.5% |
Demographics Similar to Apache by 2 or more Vehicles in Household
In terms of 2 or more vehicles in household, the demographic groups most similar to Apache are Immigrants from Cameroon (55.1%, a difference of 0.030%), Arab (55.0%, a difference of 0.030%), Immigrants from Micronesia (55.1%, a difference of 0.060%), Cree (55.1%, a difference of 0.060%), and Peruvian (55.0%, a difference of 0.13%).
| Demographics | Rating | Rank | 2 or more Vehicles in Household |
| Menominee | 46.2 /100 | #177 | Average 55.3% |
| Immigrants | Sweden | 45.3 /100 | #178 | Average 55.2% |
| Alaskan Athabascans | 42.9 /100 | #179 | Average 55.2% |
| Immigrants | Kenya | 40.4 /100 | #180 | Average 55.1% |
| Immigrants | Micronesia | 38.2 /100 | #181 | Fair 55.1% |
| Cree | 38.2 /100 | #182 | Fair 55.1% |
| Immigrants | Cameroon | 37.3 /100 | #183 | Fair 55.1% |
| Apache | 36.7 /100 | #184 | Fair 55.1% |
| Arabs | 35.9 /100 | #185 | Fair 55.0% |
| Peruvians | 33.7 /100 | #186 | Fair 55.0% |
| Immigrants | Uganda | 33.4 /100 | #187 | Fair 55.0% |
| Marshallese | 30.5 /100 | #188 | Fair 54.9% |
| Eastern Europeans | 27.5 /100 | #189 | Fair 54.8% |
| Russians | 26.3 /100 | #190 | Fair 54.8% |
| Immigrants | Immigrants | 25.0 /100 | #191 | Fair 54.7% |