Sri Lankan vs Apache 2 or more Vehicles in Household
COMPARE
Sri Lankan
Apache
2 or more Vehicles in Household
2 or more Vehicles in Household Comparison
Sri Lankans
Apache
61.0%
2 OR MORE VEHICLES IN HOUSEHOLD
100.0/ 100
METRIC RATING
20th/ 347
METRIC RANK
55.1%
2 OR MORE VEHICLES IN HOUSEHOLD
36.7/ 100
METRIC RATING
184th/ 347
METRIC RANK
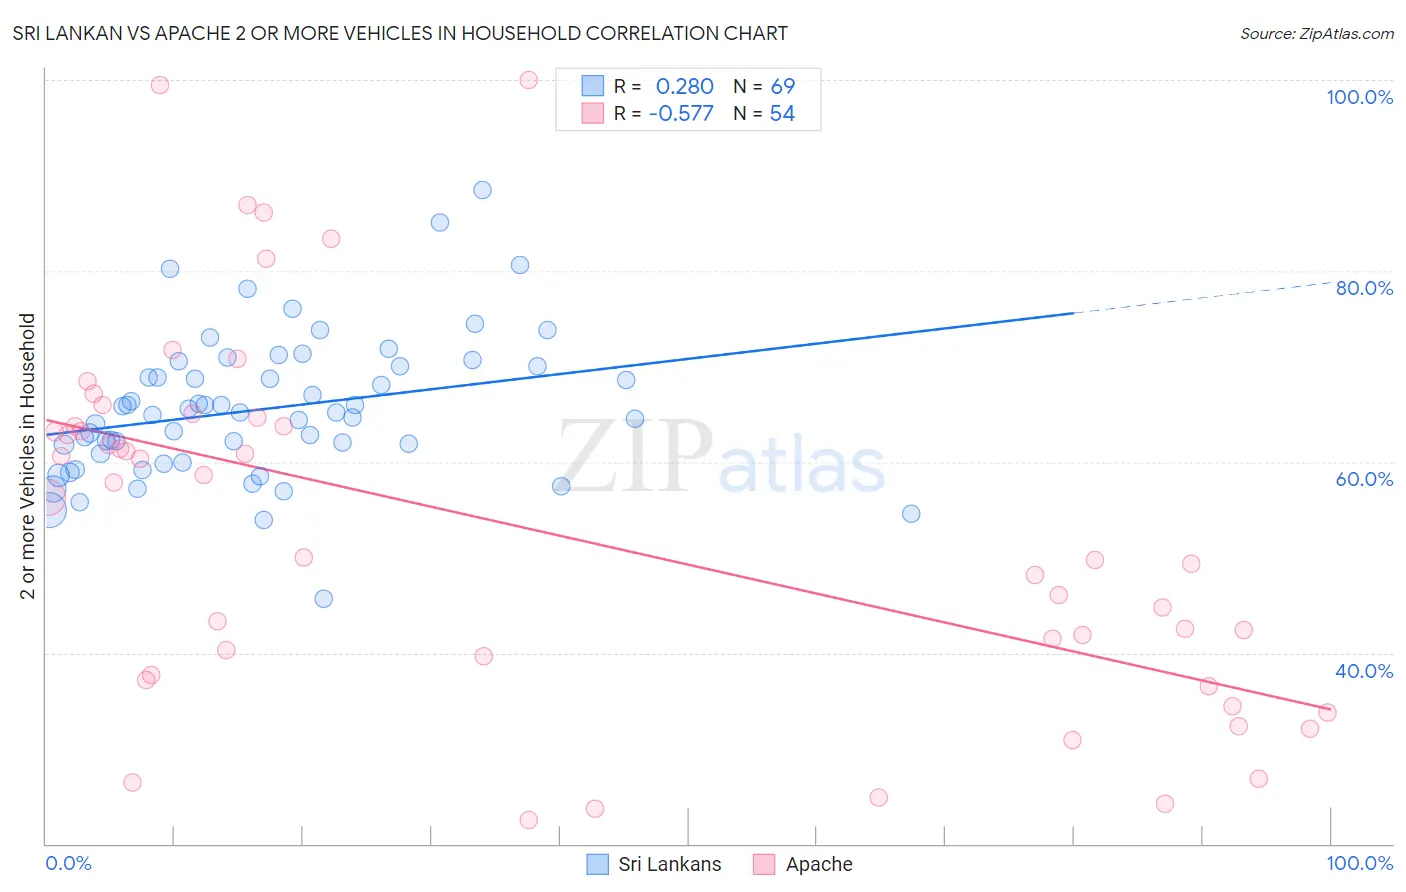
Sri Lankan vs Apache 2 or more Vehicles in Household Correlation Chart
The statistical analysis conducted on geographies consisting of 440,160,009 people shows a weak positive correlation between the proportion of Sri Lankans and percentage of households with 2 or more vehicles available in the United States with a correlation coefficient (R) of 0.280 and weighted average of 61.0%. Similarly, the statistical analysis conducted on geographies consisting of 231,042,318 people shows a substantial negative correlation between the proportion of Apache and percentage of households with 2 or more vehicles available in the United States with a correlation coefficient (R) of -0.577 and weighted average of 55.1%, a difference of 10.8%.
2 or more Vehicles in Household Correlation Summary
| Measurement | Sri Lankan | Apache |
| Minimum | 45.6% | 22.4% |
| Maximum | 88.5% | 100.0% |
| Range | 42.8% | 77.6% |
| Mean | 65.5% | 53.1% |
| Median | 65.1% | 53.1% |
| Interquartile 25% (IQ1) | 60.4% | 37.7% |
| Interquartile 75% (IQ3) | 70.0% | 63.7% |
| Interquartile Range (IQR) | 9.6% | 26.0% |
| Standard Deviation (Sample) | 7.5% | 19.2% |
| Standard Deviation (Population) | 7.4% | 19.1% |
Similar Demographics by 2 or more Vehicles in Household
Demographics Similar to Sri Lankans by 2 or more Vehicles in Household
In terms of 2 or more vehicles in household, the demographic groups most similar to Sri Lankans are Korean (61.0%, a difference of 0.040%), Swiss (61.0%, a difference of 0.080%), Scotch-Irish (60.9%, a difference of 0.12%), Immigrants from Vietnam (60.9%, a difference of 0.16%), and White/Caucasian (60.8%, a difference of 0.31%).
| Demographics | Rating | Rank | 2 or more Vehicles in Household |
| Samoans | 100.0 /100 | #13 | Exceptional 61.5% |
| Czechs | 100.0 /100 | #14 | Exceptional 61.5% |
| Nepalese | 100.0 /100 | #15 | Exceptional 61.4% |
| Native Hawaiians | 100.0 /100 | #16 | Exceptional 61.4% |
| Basques | 100.0 /100 | #17 | Exceptional 61.4% |
| Europeans | 100.0 /100 | #18 | Exceptional 61.4% |
| Scottish | 100.0 /100 | #19 | Exceptional 61.2% |
| Sri Lankans | 100.0 /100 | #20 | Exceptional 61.0% |
| Koreans | 100.0 /100 | #21 | Exceptional 61.0% |
| Swiss | 100.0 /100 | #22 | Exceptional 61.0% |
| Scotch-Irish | 100.0 /100 | #23 | Exceptional 60.9% |
| Immigrants | Vietnam | 100.0 /100 | #24 | Exceptional 60.9% |
| Whites/Caucasians | 100.0 /100 | #25 | Exceptional 60.8% |
| Welsh | 100.0 /100 | #26 | Exceptional 60.8% |
| Assyrians/Chaldeans/Syriacs | 100.0 /100 | #27 | Exceptional 60.5% |
Demographics Similar to Apache by 2 or more Vehicles in Household
In terms of 2 or more vehicles in household, the demographic groups most similar to Apache are Immigrants from Cameroon (55.1%, a difference of 0.030%), Arab (55.0%, a difference of 0.030%), Immigrants from Micronesia (55.1%, a difference of 0.060%), Cree (55.1%, a difference of 0.060%), and Peruvian (55.0%, a difference of 0.13%).
| Demographics | Rating | Rank | 2 or more Vehicles in Household |
| Menominee | 46.2 /100 | #177 | Average 55.3% |
| Immigrants | Sweden | 45.3 /100 | #178 | Average 55.2% |
| Alaskan Athabascans | 42.9 /100 | #179 | Average 55.2% |
| Immigrants | Kenya | 40.4 /100 | #180 | Average 55.1% |
| Immigrants | Micronesia | 38.2 /100 | #181 | Fair 55.1% |
| Cree | 38.2 /100 | #182 | Fair 55.1% |
| Immigrants | Cameroon | 37.3 /100 | #183 | Fair 55.1% |
| Apache | 36.7 /100 | #184 | Fair 55.1% |
| Arabs | 35.9 /100 | #185 | Fair 55.0% |
| Peruvians | 33.7 /100 | #186 | Fair 55.0% |
| Immigrants | Uganda | 33.4 /100 | #187 | Fair 55.0% |
| Marshallese | 30.5 /100 | #188 | Fair 54.9% |
| Eastern Europeans | 27.5 /100 | #189 | Fair 54.8% |
| Russians | 26.3 /100 | #190 | Fair 54.8% |
| Immigrants | Immigrants | 25.0 /100 | #191 | Fair 54.7% |