Ethiopian vs Apache 3rd Grade
COMPARE
Ethiopian
Apache
3rd Grade
3rd Grade Comparison
Ethiopians
Apache
97.4%
3RD GRADE
1.1/ 100
METRIC RATING
245th/ 347
METRIC RANK
97.8%
3RD GRADE
68.5/ 100
METRIC RATING
153rd/ 347
METRIC RANK
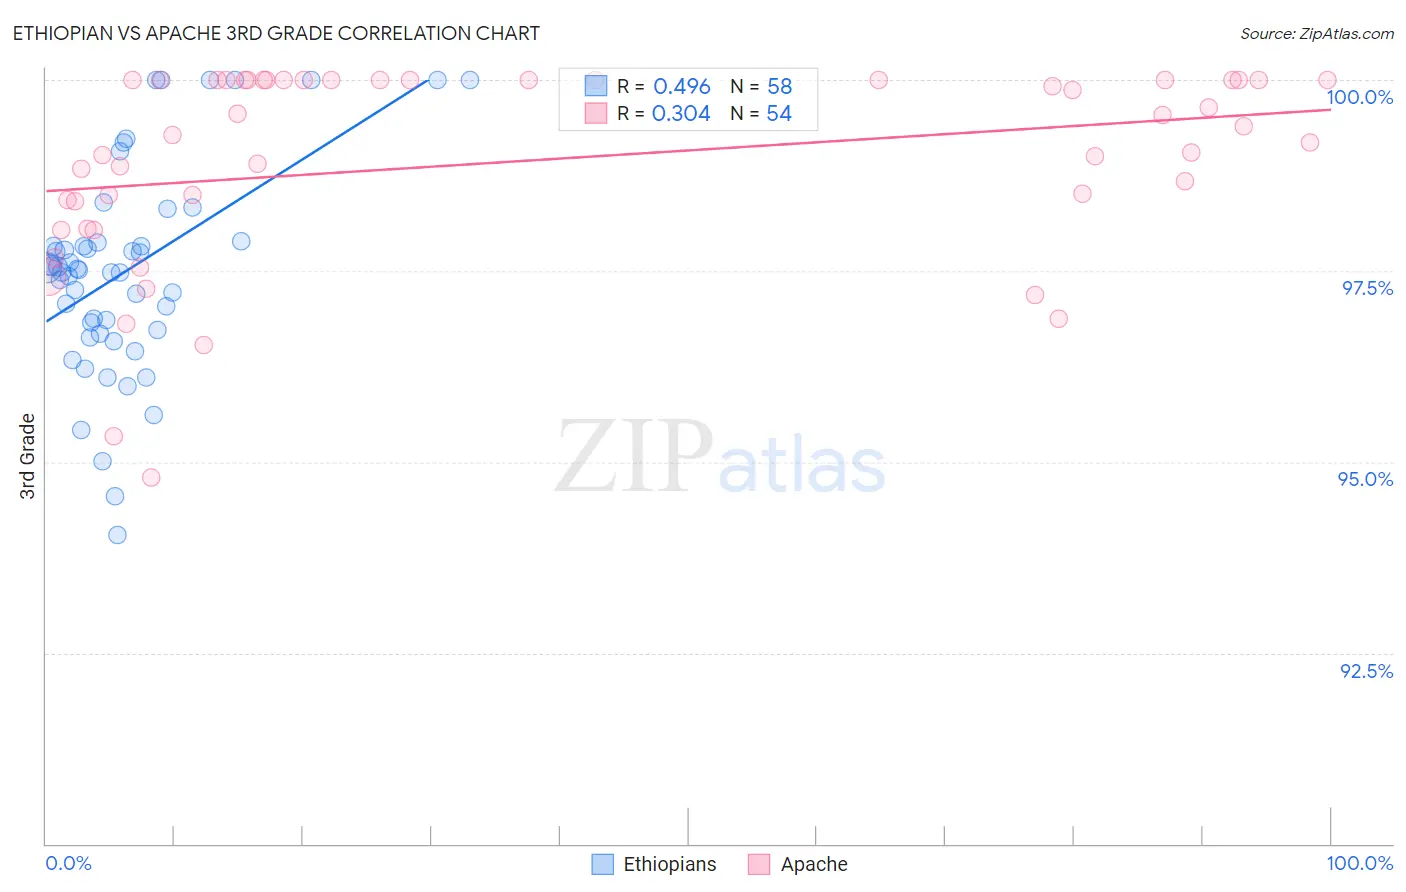
Ethiopian vs Apache 3rd Grade Correlation Chart
The statistical analysis conducted on geographies consisting of 223,120,541 people shows a moderate positive correlation between the proportion of Ethiopians and percentage of population with at least 3rd grade education in the United States with a correlation coefficient (R) of 0.496 and weighted average of 97.4%. Similarly, the statistical analysis conducted on geographies consisting of 231,142,814 people shows a mild positive correlation between the proportion of Apache and percentage of population with at least 3rd grade education in the United States with a correlation coefficient (R) of 0.304 and weighted average of 97.8%, a difference of 0.45%.
3rd Grade Correlation Summary
| Measurement | Ethiopian | Apache |
| Minimum | 94.0% | 94.8% |
| Maximum | 100.0% | 100.0% |
| Range | 6.0% | 5.2% |
| Mean | 97.5% | 98.9% |
| Median | 97.5% | 99.3% |
| Interquartile 25% (IQ1) | 96.7% | 98.4% |
| Interquartile 75% (IQ3) | 97.9% | 100.0% |
| Interquartile Range (IQR) | 1.1% | 1.6% |
| Standard Deviation (Sample) | 1.4% | 1.3% |
| Standard Deviation (Population) | 1.3% | 1.3% |
Similar Demographics by 3rd Grade
Demographics Similar to Ethiopians by 3rd Grade
In terms of 3rd grade, the demographic groups most similar to Ethiopians are Asian (97.4%, a difference of 0.0%), Indian (Asian) (97.4%, a difference of 0.010%), Immigrants from Senegal (97.4%, a difference of 0.010%), Assyrian/Chaldean/Syriac (97.4%, a difference of 0.010%), and U.S. Virgin Islander (97.4%, a difference of 0.020%).
| Demographics | Rating | Rank | 3rd Grade |
| Immigrants | Uruguay | 1.7 /100 | #238 | Tragic 97.4% |
| Nigerians | 1.6 /100 | #239 | Tragic 97.4% |
| U.S. Virgin Islanders | 1.4 /100 | #240 | Tragic 97.4% |
| Immigrants | Indonesia | 1.4 /100 | #241 | Tragic 97.4% |
| Koreans | 1.3 /100 | #242 | Tragic 97.4% |
| Indians (Asian) | 1.3 /100 | #243 | Tragic 97.4% |
| Asians | 1.1 /100 | #244 | Tragic 97.4% |
| Ethiopians | 1.1 /100 | #245 | Tragic 97.4% |
| Immigrants | Senegal | 1.0 /100 | #246 | Tragic 97.4% |
| Assyrians/Chaldeans/Syriacs | 1.0 /100 | #247 | Tragic 97.4% |
| Immigrants | Eastern Africa | 0.9 /100 | #248 | Tragic 97.4% |
| South Americans | 0.9 /100 | #249 | Tragic 97.4% |
| Immigrants | Middle Africa | 0.9 /100 | #250 | Tragic 97.4% |
| Immigrants | Asia | 0.8 /100 | #251 | Tragic 97.4% |
| Peruvians | 0.8 /100 | #252 | Tragic 97.4% |
Demographics Similar to Apache by 3rd Grade
In terms of 3rd grade, the demographic groups most similar to Apache are Immigrants from South Central Asia (97.8%, a difference of 0.0%), Jordanian (97.8%, a difference of 0.020%), Soviet Union (97.8%, a difference of 0.020%), Immigrants from Eastern Europe (97.8%, a difference of 0.020%), and Bermudan (97.8%, a difference of 0.020%).
| Demographics | Rating | Rank | 3rd Grade |
| Alsatians | 78.3 /100 | #146 | Good 97.9% |
| Immigrants | Israel | 77.3 /100 | #147 | Good 97.9% |
| Immigrants | Moldova | 77.1 /100 | #148 | Good 97.9% |
| Immigrants | North Macedonia | 74.5 /100 | #149 | Good 97.8% |
| Jordanians | 74.5 /100 | #150 | Good 97.8% |
| Soviet Union | 72.6 /100 | #151 | Good 97.8% |
| Immigrants | South Central Asia | 69.5 /100 | #152 | Good 97.8% |
| Apache | 68.5 /100 | #153 | Good 97.8% |
| Immigrants | Eastern Europe | 64.1 /100 | #154 | Good 97.8% |
| Bermudans | 62.6 /100 | #155 | Good 97.8% |
| Immigrants | Russia | 61.7 /100 | #156 | Good 97.8% |
| Immigrants | Italy | 61.2 /100 | #157 | Good 97.8% |
| Venezuelans | 60.9 /100 | #158 | Good 97.8% |
| French American Indians | 60.0 /100 | #159 | Average 97.8% |
| Immigrants | Iran | 59.1 /100 | #160 | Average 97.8% |