English vs Cree Unemployment
COMPARE
English
Cree
Unemployment
Unemployment Comparison
English
Cree
4.6%
UNEMPLOYMENT
100.0/ 100
METRIC RATING
11th/ 347
METRIC RANK
5.6%
UNEMPLOYMENT
2.6/ 100
METRIC RATING
240th/ 347
METRIC RANK
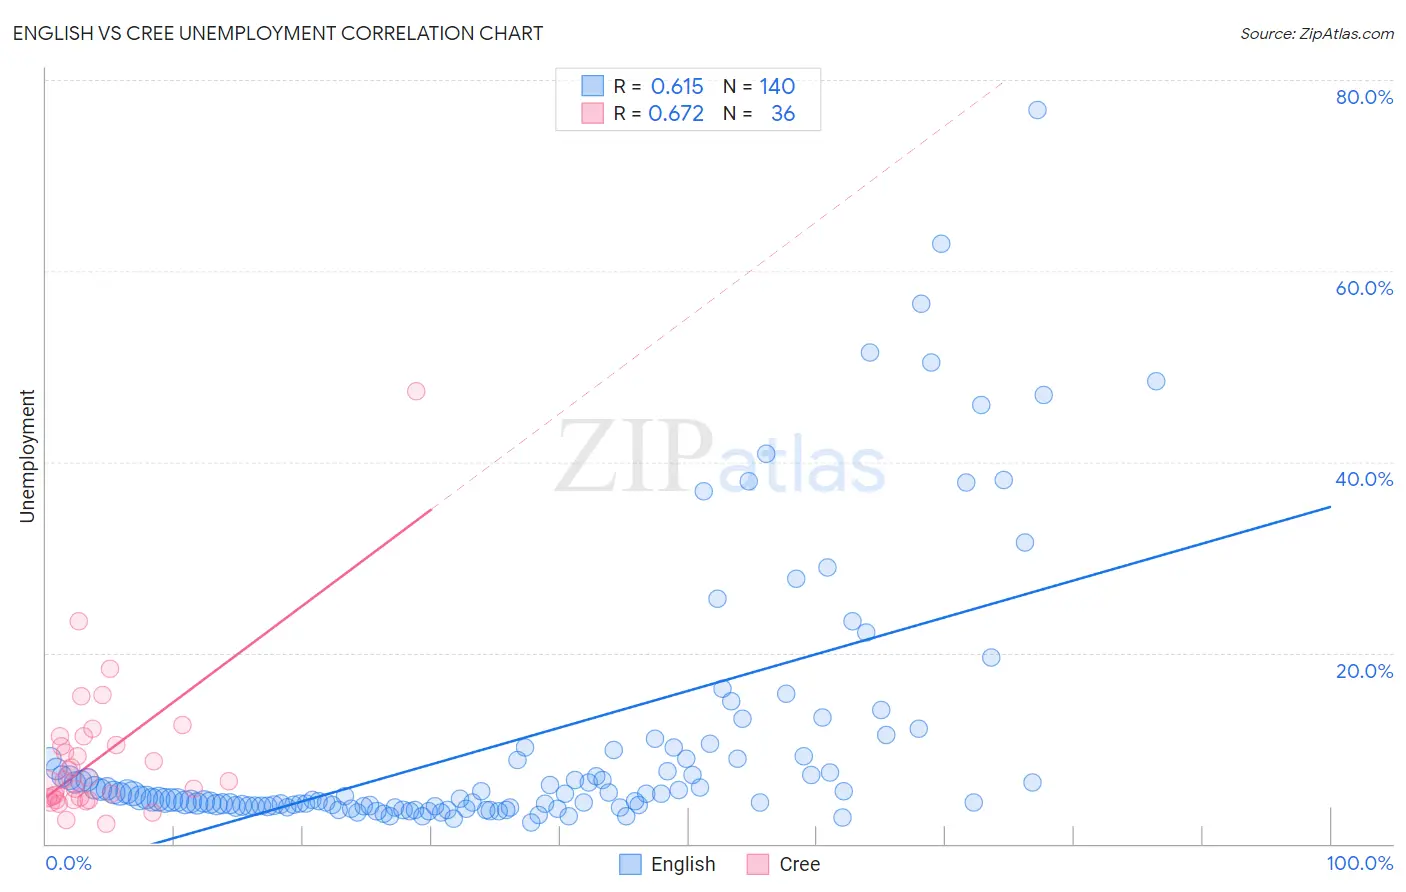
English vs Cree Unemployment Correlation Chart
The statistical analysis conducted on geographies consisting of 574,199,976 people shows a significant positive correlation between the proportion of English and unemployment in the United States with a correlation coefficient (R) of 0.615 and weighted average of 4.6%. Similarly, the statistical analysis conducted on geographies consisting of 76,166,078 people shows a significant positive correlation between the proportion of Cree and unemployment in the United States with a correlation coefficient (R) of 0.672 and weighted average of 5.6%, a difference of 20.6%.
Unemployment Correlation Summary
| Measurement | English | Cree |
| Minimum | 2.3% | 2.1% |
| Maximum | 76.9% | 47.4% |
| Range | 74.6% | 45.3% |
| Mean | 10.6% | 9.1% |
| Median | 4.9% | 6.6% |
| Interquartile 25% (IQ1) | 4.0% | 4.7% |
| Interquartile 75% (IQ3) | 9.0% | 10.8% |
| Interquartile Range (IQR) | 5.0% | 6.1% |
| Standard Deviation (Sample) | 13.7% | 8.0% |
| Standard Deviation (Population) | 13.6% | 7.9% |
Similar Demographics by Unemployment
Demographics Similar to English by Unemployment
In terms of unemployment, the demographic groups most similar to English are Pennsylvania German (4.6%, a difference of 0.10%), Belgian (4.6%, a difference of 0.26%), Immigrants from Cuba (4.6%, a difference of 0.50%), Dutch (4.6%, a difference of 0.66%), and European (4.6%, a difference of 0.98%).
| Demographics | Rating | Rank | Unemployment |
| Danes | 100.0 /100 | #4 | Exceptional 4.3% |
| Swedes | 100.0 /100 | #5 | Exceptional 4.4% |
| Germans | 100.0 /100 | #6 | Exceptional 4.5% |
| Immigrants | India | 100.0 /100 | #7 | Exceptional 4.5% |
| Swiss | 100.0 /100 | #8 | Exceptional 4.5% |
| Scandinavians | 100.0 /100 | #9 | Exceptional 4.5% |
| Dutch | 100.0 /100 | #10 | Exceptional 4.6% |
| English | 100.0 /100 | #11 | Exceptional 4.6% |
| Pennsylvania Germans | 100.0 /100 | #12 | Exceptional 4.6% |
| Belgians | 100.0 /100 | #13 | Exceptional 4.6% |
| Immigrants | Cuba | 100.0 /100 | #14 | Exceptional 4.6% |
| Europeans | 99.9 /100 | #15 | Exceptional 4.6% |
| Chinese | 99.9 /100 | #16 | Exceptional 4.7% |
| Slovenes | 99.9 /100 | #17 | Exceptional 4.7% |
| Immigrants | Venezuela | 99.9 /100 | #18 | Exceptional 4.7% |
Demographics Similar to Cree by Unemployment
In terms of unemployment, the demographic groups most similar to Cree are Immigrants (5.5%, a difference of 0.010%), Immigrants from Western Asia (5.5%, a difference of 0.10%), Moroccan (5.5%, a difference of 0.31%), Tlingit-Haida (5.6%, a difference of 0.34%), and Spanish American (5.6%, a difference of 0.35%).
| Demographics | Rating | Rank | Unemployment |
| Immigrants | Syria | 4.8 /100 | #233 | Tragic 5.5% |
| Panamanians | 4.7 /100 | #234 | Tragic 5.5% |
| Immigrants | Panama | 3.4 /100 | #235 | Tragic 5.5% |
| Immigrants | Cambodia | 3.3 /100 | #236 | Tragic 5.5% |
| Moroccans | 3.2 /100 | #237 | Tragic 5.5% |
| Immigrants | Western Asia | 2.8 /100 | #238 | Tragic 5.5% |
| Immigrants | Immigrants | 2.6 /100 | #239 | Tragic 5.5% |
| Cree | 2.6 /100 | #240 | Tragic 5.6% |
| Tlingit-Haida | 2.0 /100 | #241 | Tragic 5.6% |
| Spanish Americans | 2.0 /100 | #242 | Tragic 5.6% |
| Marshallese | 1.3 /100 | #243 | Tragic 5.6% |
| Dutch West Indians | 1.2 /100 | #244 | Tragic 5.6% |
| French American Indians | 1.2 /100 | #245 | Tragic 5.6% |
| Bermudans | 1.1 /100 | #246 | Tragic 5.6% |
| Immigrants | Cameroon | 1.0 /100 | #247 | Tragic 5.6% |